SNAG-View Application Monitoring
With SNAG-View, application monitoring can be set up very easily and very comprehensively!
Using the ticket system Znuny as an example, we show you how deeply you can monitor an application.
Here you will find our monthly tips to improve your OTRS, i-doit, SNAG-View and NeDi configuration. If you need support in setting up your systems or need special adaptations, then simply contact us at +49 441 390 10 10 40 or send us an e-mail, we will be happy to advise you.
More than 100 customers from all areas of business and public administration trust our software solutions and services.


by Martin Haubold
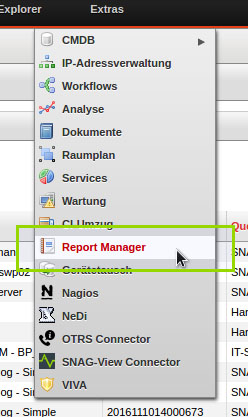
Every user in i-doit has the ability to configure their own dashboard. To allow this to happen, a number of pre-configured widgets are provided. Among other things, the "Report" widget can be displayed. This example embeds a report that provides information on the objects associated with the user ("Contact assignment" category), and which were last edited by another user. For this configuration, the user needs the "Create report" and "Configure your own dashboard" rights. First of all, a report needs to be created. The Report Manager is found in the menu below "Tools":
Next create a simple report that displays the following attributes of the objects:
The approach for creating a report is described very well in the i-doit Knowledge Base, and is not explained in detail at this point.
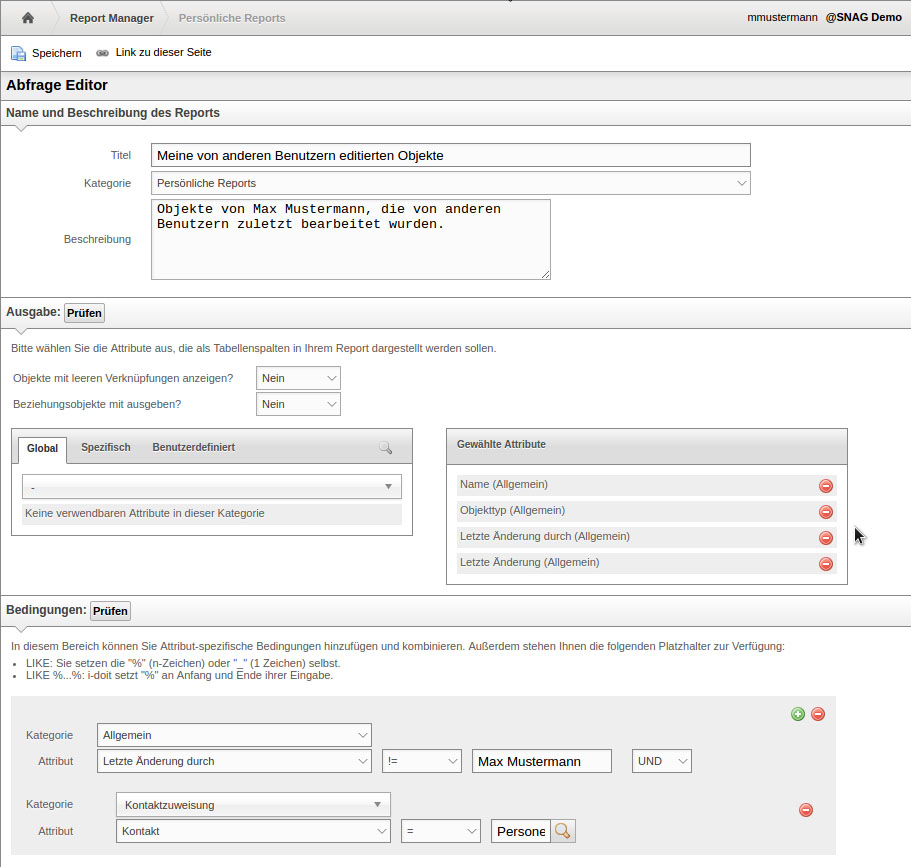
In the "General" category conditions, the user's full name is entered for the "Last change by" attribute and linked to "is unequal to". After saving, the report can be run.
Now go to the Dashboard, and clicking on pencil icon below the username to open the Dashboard configuration.
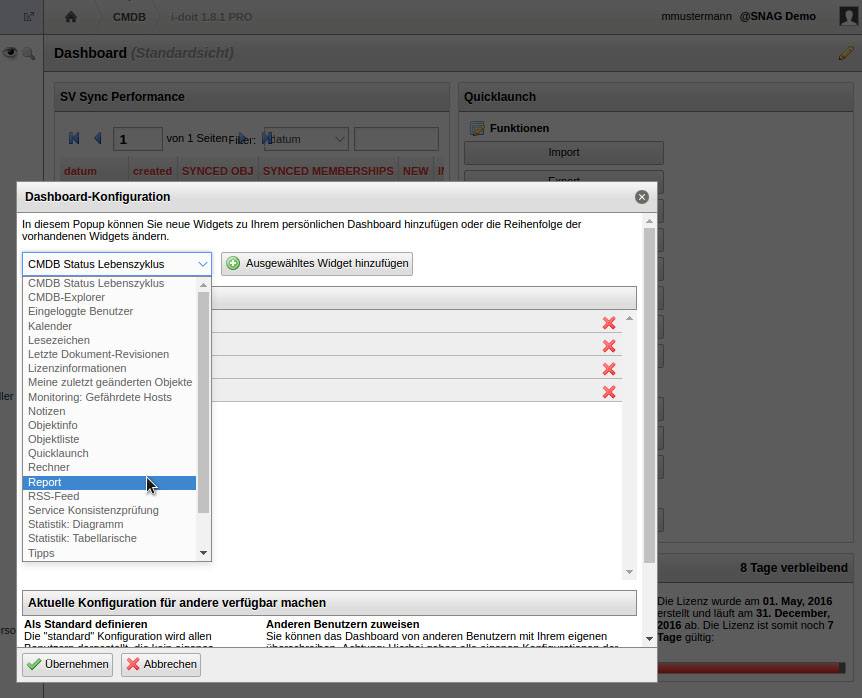
Select "Report" in the dropdown and press the button to add. You can also use drag and drop to define the position of the report on the Dashboard. The widget appears on the Dashboard after pressing "Apply". The widget still does not have any content. When you hover the mouse pointer over the header of the report widget, you can select the desired report by clicking on the pencil icon. You can also define how many objects appear on one page of the widget's output. The results of this report appear on the Dashboard after pressing "Apply".

In the view window, you can click to sort objects by a respective column. By default, sorting is by the object name.