Monitoring
SNAG-View 4 - Metric Based Monitoring
SNAG-View 4
Paradigm shift in monitoring
Time Series Database
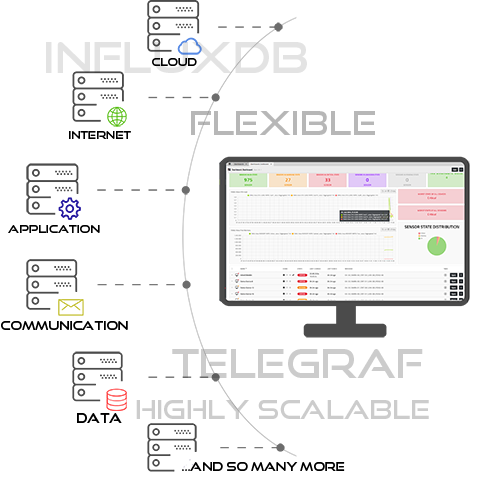
Latest database technology with optimized data storage and automated data aggregation
Telegraf Input Plugins
SNAG-View 4 is based on the most modern way of collecting metrics
The best of both worlds
SNAG-View 4 users can continue to use their existing Nagios-compliant checks and benefit from the advantages of the new technology at the same time
Intuitive UX design
Particularly user-friendly and intuitively designed interface
Developed in Go
The entire architecture of SNAG-View 4 is developed in Go and therefore offers high performance, stability and data security
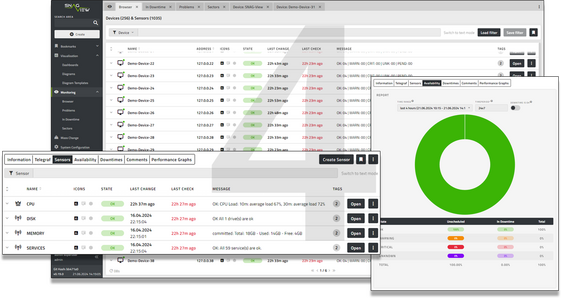
Monitor complex IT infrastructures
SNAG-View can be used to monitor complex IT infrastructures. In addition to the conventional integration of Nagios plug-ins, the new Telegraf check engine forms the basis for this. But SNAG-View offers even more: you can visualize your IT infrastructure, receive notifications, and access all data via intelligent interfaces.
Areas that you can monitor with SNAG-View: Operating systems (Windows, Linux, MacOS...), databases (MySQL, MSSQL, Oracle...), applications (ERP systems..), networks, storage, room monitoring, hardware (servers, switches, clients) as well as virtualization (VMware ESX, VMware View) and much more
Success Story
Smooth migration from SNAG-View 3 to SNAG-View 4 at Löwenstein Medical
The Challenge:
Löwenstein Medical has been using SNAG-View 3 successfully for years. The transition to the latest version, SNAG-View 4, presented the challenge of ensuring a migration without interrupting business processes.
The Solution:
Thanks to the well-designed migration tools for the transition from SNAG-View 3 to SNAG-View 4, Löwenstein Medical was able to make the switch seamlessly. The new Telegraf-based solution, SNAG-View 4, offers an improved user experience and expanded features. Existing Nagios plugins were able to be retained and gradually replaced with Telegraf input plugins.
The Implementation:
-
Preparation: SECTOR NORD carefully planned the migration and utilized the available tools to ensure a smooth transition. Valuable experiences were already gathered during the beta phase of SNAG-View 4.
-
Implementation: The migration was carried out multiple times on a test system to check compatibility and performance.
-
Completion: After successful testing, SNAG-View 4 was integrated into the production environment, with the migration tools being crucial.
The Results:
-
Continuity: The business processes remained uninterrupted during the migration.
-
Efficiency: The new solution enhances monitoring and makes IT monitoring future-proof.
-
Future-proofness: With SNAG-View 4, Löwenstein Medical is well-prepared for upcoming technical demands.
Conclusion:
"Die Migration zu SNAG-View 4 war ein voller Erfolg. Löwenstein Medical profitiert nun von einer modernen Monitoring-Lösung, die nicht nur die aktuelle IT-Landschaft effizient überwacht, sondern auch eine solide Basis für zukünftige Innovationen bietet. Die nahtlose Migration zeigt die Kundenorientierung und technische Kompetenz von SNAG-View"
[Translation: The migration to SNAG-View 4 was a complete success. Löwenstein Medical now benefits from a modern monitoring solution that not only efficiently oversees the current IT landscape but also provides a solid foundation for future innovations. The seamless migration demonstrates SNAG-View's customer orientation and technical expertise.]
Christoper Rust - Leader IT Infrastructure / Information Security Officer
Basic Features
The dashboard management of SNAG-View offers the possibility to create a fully customizable interface. A multitude of useful widgets combined with a precise filter system make it possible to select or combine specific information and display it in a variety of ways, for example as a key figure, graph or list. To obtain a personal overview of the processes monitored in SNAG-View, each user can manage their own dashboards. All views can be moved and arranged using drag'n'drop. The contained elements are saved separately and restored when logging in.
The browser provides a clear overview of the status of all devices and sensors with SNAG-View. As a central part of monitoring in SNAG-View, the browser is always activated alongside the dashboard when SNAG-View is started. It offers a wide range of filter options in order to optimally adapt the view to every need. Filtered views can be saved as bookmarks so that they can be quickly accessed again later. In addition, the filters created can be saved separately so that they can be reused anywhere in SNAG-View 4.
Subscription €279 monthly
(Annual billing)
Advanced Support €359 monthly
(Annual billing)
Community Plugins
Use Telegraf to collect metrics from databases, servers, and systems as well as IoT sensors. With over 300 plugins, you can set up and customize the monitoring of your IT landscape. The Telegraf agent can be automatically rolled out to the target systems using the open source automation tool Ansible.
SNAG-View 4 is also compatible with all Nagios Community-Plugins. Once the plugin has been successfully imported, the checks provided by the plugin can be created and configured via the SNAG-View web frontend.

€0.00
No licensing fees
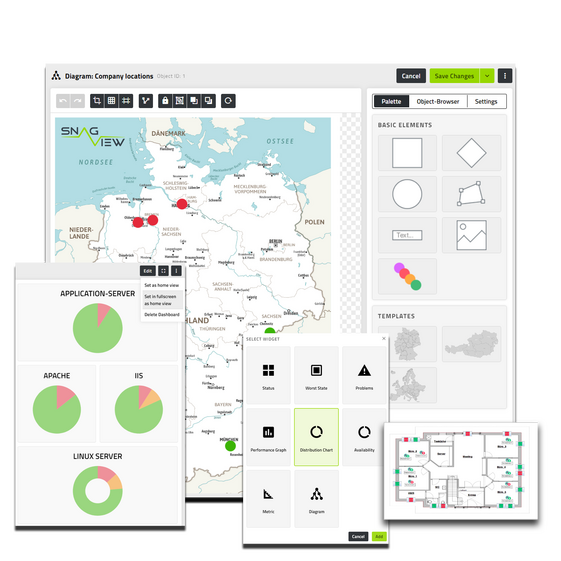
Visualisation with diagrams
Use different visualisation options in SNAG-View - whether in a classic list view, as a dashboard, or integration via self-defined maps. Flexibly display information where you need it.
Customised maps, buildings and site plans can be created using the Diagrams add-on. Display the current live status of your stored devices and sensors directly in the maps and add them to your dashboards as a widget.
By automatically filling in the corresponding status values, you are able to visualise the existing data and thus evaluate it much better. The Diagrams add-on serves as an editor for creating diagrams, which you can design as you wish. Examples of this would be the world/European map or the floor plan of your company building, etc.
Diagrams is a further development of our established visualisation solution for IcingaWeb2 VISION
Subscription €34.90 monthly
(Annual billing)
Automation
Utilise the power of the Automation add-on and let the it do what you would otherwise have to do by hand!
Create freely definable rules so that SNAG-View can react automatically to events and carry out further follow-up actions. Freely definable filters, the entire object pool, events and actions are available to you for further configuration.

Subscription €34.90 monthly
(Annual billing)
SMSEagle & brevis.one
With the hardware solutions from our partners SMSEagle and brevis.one, we have provided you with add-ons to professionally expand alerting and ensure you have another reliable way for alerting/notifications at your side, independent of email communication.
The solutions of SMSEagle provide you with a voice call function in addition to the SMS function. The voice call is intended as a wake-up call in the event of very serious faults or system failures.
Further details on the SMS gateways can be found via the following links:
Subscription €34.90 monthly (without hardware)
(Annual billing)
SNAG-View - Central component in the ITSM-Connector
SNAG-View 4 is part of the ITSM-Connector developed by us.
Create added value - link your data, your information, your processes with the bidirectional SNAG-View connectors:

SNAG-View 4
Changelog
# SV4 4.8.0 Release Notes
Release date: 13-03-2026
# SV4 4.7.0 Release Notes
Release date: 22-01-2026
## New Features
- More flexibility in the evaluation of metrics with the multi-metrics interpretations
- evaluate multiple metric fields in correlation to each other by
- setting a condition for each field ( check all metrics if fieldA is 2 and fieldB s 4)
- filter evaluated metrics on a fields value (check for all metrics that if fieldA is 2, fieldB should be 4)
- New `offset` feature for telegraf configuration
- execution of checks can now be staggered with a definable `offset`
- One can define the total time range and the steps, the checks are staggered inside the given time range
- Managing remote telegrafs via ansible can now be used in environments, where the used ssh user needs a password to become root
## Features
* #2558 Add offset to telegraf to spread many checks
* #2623 Add "ansible_use_password_to_become_root" for remote sudo
* #2652 Interpret multiple metrics in dependency to each other
* #2659 Update frontend for multi metric interpretations
* #2665 Feature Request - User Rollen Count
## Improvements
* #2026 Provide list where only sensors are displayed
* #2033 Make dropdown search fuzzy
* #2333 Consolidate formData and centralize it for all object types
* #2373 Switch frontend data management to Pinia Store
* #2469 Import: cells with tag values should be lowercased before matching
* #2484 Add dependency-cruiser as a new validation job for the pipeline
* #2510 Rework input field for execute config to be more comfortable to work with
* #2543 Improve checks for licensed routes
* #2579 Add more masschange actions to sensors
* #2640 Remove tab groups
* #2644 Widgets should push other widgets away on move
* #2673 Option to Close Tabs do not work in Maintab
* #2742 Define UTF-8 as standard for csv file for import
* #2776 delete tests based on sqlmock
## Bugs
* #2044 Values above max character limit are not intercepted in device creation or editing
* #2118 Complex filters (e.g. comparison of “state” and “startup_mode” for metrics of Windows services) cannot be created
* #2322 Creating multiple devices ends up in wrong entries in dropdown for device sensor
* #2405 Previously open views are not reset properly
* #2546 use recovery middleware to avoid crashing the api
* #2594 Time range in perfgraph editor always jumps to "last 4 hours"
* #2621 URL for release notes wrong
* #2624 Link to objects in SNAG-View 4 does not work if user is not logged in
* #2646 implement several bugfixes / improvements
* #2667 Browser Scrollbar not working in filter
* #2668 Diagrams: Template is empty
* #2669 Customfields are not unique and overwritten without an error message
* #2676 CSS/Javascript Error - Scrollbar CSS not working, filter field is to short
* #2677 No tool tip if more than five values in performance graph
* #2682 Gocron jobs are executed twice on startup
* #2683 Can't update tagged objects via import with same tag
* #2685 Quick search does not work with comments
* #2686 Telegraf Offset Interval can't be 0ms even when Offset is 0m
* #2688 Dashboard widget can not read metric if "space" or backslash exists
* #2707 Can not create custom fields without value for device or device template via frontend
* #2711 Cannot create device with telegraf due to faulty offset validation
* #2743 BOM in csv file prevents import or creating import
* #2745 Cursor jumps to last position if editing name of vault entry
* #2749 "devicecheck_state" filter does not work for sensors in browser
* #2750 Tag is not displayed with lowercase in tab after creation and updating tags allows for tags that are not lowercased
* #2754 No device sensor in device edit mode
* #2755 Can't create downtime in device or sensor
* #2756 No availability in sensors
* #2759 Action attribute only loads after entering edit mode
* #2760 No create date in rules
* #2765 Editing Teams and Users in Telegraf is broken
* #2767 Inconsistency when removing template of device sensor from device template
* #2773 Failed bulk import does not create import log
* #2774 flush_interval update rejects duration strings
* #2777 Token login can used with 2fa
* #2778 switcher resets to first entry instead of preserving active switcher
* #2780 filter tooltip icon in automation is cut off
* #2781 wrong tooltip is diplayed in automation action form
* #2783 Can not select tags for Performance graph widget in dashboard
* #2785 Wrong default value in Telegraf Template causes error
* #2789 Duplicate Parameter in Automation create Service
* #2810 Aggregation task aggregation_15d has to be reworked
* #2816 Clear Session Log does not work

## Highlights
### Second iteration of import module
The import module now supports not only the creation of new objects but also updating existing ones and deleting/deactivating objects that are missing in subsequently imports. The mapping to existing objects is done through a filter.
Second you can get full insight of an import execution via the new import log view: Here you can see all executed imports with all actions taken: created, updated, deleted, disabled, ignored - mapped to the CSV line responsive for the action.
### Multi-image-upload
You now can use our brand new image upload formular to upload multiple images at once.
### more
- The colour of the state widget can now be set for the case if no object matches the filter.
- You can copy a Sensor to the same Device
## Features
* #2341 Prepare backend for validation
* #2513 Implement import log
* #2514 CRUD for import execution
* #2524 Make colours of state widgets adjustable if there no hits for sensors or devices
* #2528 add devicesensor id to devicedetailed response
* #2541 Copy Sensor on the same Device
## Improvements
* #1502 Add option to upload multiple images
* #2311 Get rid of goquality
* #2315 clean up old k6 test code
* #2332 Replace vuex store with Pinia
* #2471 Script collection to reset test environment to a defined state
* #2627 merge moving schemas into own package into develop
## Bugs
* #2055 Resolved checkcommand is not visible if window is too small
* #2056 Status-Widget preview does not refresh when switching to "sensor"
* #2076 Telegraf agent configuration: time input fields ignore days
* #2081 Duration input field can be crashed with large numbers
* #2085 Switching payload type overwrites headers
* #2095 Empty repository path is only intercepted on saving
* #2097 Empty TLS-Cert and TLS-Key path are not mandatory if TLS is true
* #2098 Refresh Interval does not behave correctly in tabs
* #2130 Modal disappears clicking on error message
* #2141 Filterbar not refreshing
* #2152 Parameters can not be updated while creating nagios command
* #2174 Search result not visible when copying performance graph configuration
* #2184 Assigned telegraf should not be a pointer
* #2195 It should not be possible to copy objects from i-doit
* #2197 For performance graph widgets that were created on a command the host and senor name missing in the performance graph widget of the sensor.
* #2241 Date picker for performance graph is buggy
* #2242 Results of mass actions for telegraf not scrollable
* #2252 Tags with "\," in value are not parsed correctly
* #2267 Filter do not work in Diagrams Objects
* #2271 No graphical feedback when doing connection test for telegraf
* #2273 The telegraf/:name/connection endpoint is not excluded from the request timeout
* #2292 Performance graphs for device not alphabetical sorted
* #2306 Dropdown does not select object that is not preloaded
* #2308 Changing the command on the sensor template does not update the form correctly
* #2310 Filter operators "between", "greater" and "lower" provide wrong results for string fields
* #2321 Copying device does not copy telegraf of device
* #2323 List page is not refreshed when filter is applied
* #2328 Removing selection of device sensor has no effect
* #2409 ssh keyfile authentication not applied when creating Telegraf from template
* #2410 panic: runtime error - (*AvailableMetric).Hydrate for faulty AvailableMetrics in database
* #2466 Diagrams "open filter" works only after reload page
* #2474 Quick search - wrong results with hits for different object types
* #2475 Search is limited to 50 hits
* #2476 Wrong count of hits of object type "device" in search
* #2490 Custom homeview only applies after login
* #2505 Wrong URL in Notification Center by devices without telegraf
* #2506 search index generation logs error when updating downtimecomment
* #2523 applying a template when creating a device empties address
* #2526 duration fields of telegraftemplate are not formatted properly
* #2554 Migrationtool hangs on import from sv3 if one object types list could not be fetched
* #2580 Special characters e.g. "#" in organization unit name prevent import of users
* #2643 Login to frontend with token not possible
* #2651 Rating does not include all values for state calculation
* #2653 Analyse: Date picker does not work as expected if not choosing time
## Improvements
* #2536 Add logrotate to telegraf.conf
* #2372 Test and fix migration tool for newest SNAG-View 4 version
## Bugs
* #2313 Make the "surname” field optional in the directory service configurations
* #2317 A higher count of images cause issues for action "select an image"
* #2327 Duplicate login with diffent directoryservices causes permissions fails
* #2512 Interpretations not shown in Sensortemplates Ratings after Update to 4.5.0
## Main Features
- Improved menu and tab structure
- SSH authentication method for windows telegrafs
- Configurable title for the SNAG-View 4 browser tab
## Import-Addon Preview
- Preview of the upcoming import addon - until release it will be a free preview. After the release it has to be purchased as a normal SNAG-View 4 Addon.
## Feature-Set
- Import devices via .CSV files
- configure column mapping
- set multiple columns as tags or custom variables
- set a column as device template, the column fields have to contain device template names
- set a default device-template for all imported devices
- automated sensor creation
- automated telegraf creation and deployment
## Prospects
- Import from CSV, JSON, YAML
- Import directly from databases via sql queries
- Import only new objects, update existing ones and delete old ones that no longer exist in the current import source
- Import a wide range of object types
- Advanced mapping of fields (multi value fields)
- dry run of an import to see the changes before they happen
- use rules to alter, add or remove columns and set attributes
## Improvements
- #2298 Restructure tabs and menu structure
- #2301 Add horizontal scroll for long tags in perfgraph editor
- #2020 Do not open tabs if sensor was copied to more than one device
- #1971 Make authentication method "SSH" available for telegraf with system type "Windows"
- #1834 Remove zipping for installation packages of svcheck and telegraf for unmanaged telegrafs
- #1748 Update dependencies in build image
- #1867 Add device name to delete telegraf response
- #2250 Add option to set start type for telegraf on windows to automatic (delayed start)
- #2000 Standardise using quotes in *.yml-files
- #2009 Create progressbar component
- #2124 Configurable tab name in the browser
## Bugs
- #2254 Changes made in device are not sent to telegraf config
- #2268 Big requests are not processed in one transaction
- #2247 Duration in filters only supports seconds as time unit
- #2140 Using a device template does not apply telegraf template values in frontend form
- #1758 API: Wrong success message if install svchecks for single telegraf
- #2287 Creating a device with invalid template id causes nil pointer dereference
- #2220 Users and teams are not saved correctly for rule actions
- #2297 Context menus do not close when clicking outside of them
- #2305 Placeholder for non existent assigned telegraf in sensor should not be clickable
- #2290 Can't close modal when adding a rating to a collection
- #2013 Add and remove tags through mass change does not work for diagrams and diagram templates
- #2274 Adding escalation to empty rule causes backend to panic
- #2312 Directory Service Filter of type "filter" kills backend
- #2278 Can't create device with sensor from sensor template or sensor from sensor template
- #2289 Can't copy Sensor
- #2307 execute_config for sensor templates is empty instead NULL
- #2264 Check for tmp-folder is done twice in main.go
- #2277 Vault macros not available for brevis.one and smseagle (server configuration)
- #2256 Wrong default values in LOCAL-MEM command
- #2325 Create sensor does not create new telegraf.conf
-
#2488 DB field "homeview" is too small
- #2267 Filter does not work in diagrams objects
##Improvements
#2226 Improve Issue-Templates
##Bugs
#2288 Missing SQL update script in 4.4.1
#2233 Dashboard browser widget does not display content
#2200 Dashboard metric widget is only supporting nagios perfdata
#2192 Temporary file “telegraf.conf” (gather metrics) can lead to problems.
#2249 Short duration spikes in performance graphs can lead to misinterpretation
#2185 Copy Sensor on same Device is not possible
#2257 Deactivated devices and sensors still appear in telegraf config
#2221 Can't copy devices
#2199 AD Syna error with underlines in sAMAccountname
## Improve ratings and interpretations for inputs with many metrics
- #1935 Combine interpretations for all states into one single interpretation
- #1938 Add rating groups
- #1940 Add new sensor filter for ratings
## Implement cypress CRUD frontend tests
- #2230 Implement user cypress CRUD frontend tests
- #2228 Implement device template cypress CRUD frontend tests
- #2215 Implement diagram cypress CRUD frontend tests
- #2229 Implement rating cypress CRUD frontend tests
- #2225 Implement token cypress CRUD frontend tests
- #2227 Implement Role cypress CRUD frontend tests
- #2217 Implement diagramtemplate cypress CRUD frontend tests
## Improvements
- #2080 Implement connection test for telegraf
- #1243 Add "Rating" to sensor create dialog
- #1862 Rating: Value for measurement "nagios_state" should be restricted to digits 0 to 3
- #1379 Implement "State Change" filter
- #1853 Missing tooltip for long values in select fields in Rating Interpretation form
- #2068 Search-and-Replace is accidentally triggered if description field content matches search-and-replace regex
## Bugs
- #2070 Wrong state assignment for timeperiods with short duration
- #2110 Links on the pie chart pieces of the distribution chart widget are wrong
- #2149 State circle in device list is always black
- #1863 Preview the current Value of selected metric in Ratings Interpretation form
- #2176 Sector-Telegraf-List: distribution chart not shown if no sensor is assigned
- #2201 Can't add perfgraph to sensors when creating a device
- #2132 Telegraf: System type does not change directly in form
- #1854 Some tables in database "svtmp" are not recreated after restarting SNAG-View 4
## Bugs
- #2244 Sensor filter is not working anymore with filter attributes for devicecheck
## Bugs
- #2236 Notification is sent even if sensor is back to ok
- #2235 Changing time range is not adopted by performance graphs
## Internal
- #2215 Implement diagram cypress CRUD frontend tests
- #2227 Implement Role cypress CRUD frontend tests
## Bugs
- #2216 Protocol is missing for proxy telegraf
## Bugs
- #2209 Device "check_state" filter is not working
- #2208 Automatically created performance graphs cannot be edited
- #2207 Copy - Performancegraph - too many placeholders error
- #2211 Column name is sometimes hidden
Bugfix Release
## Improvements
- #2111 Distribution chart widget should allow state type selection for devices
- #1862 Rating: Value for measurement "nagios_state" should be restricted to digits 0 to 3
- #1914 Telegraf distribution refactoring
## Bugs
- #2145 Current assigned sector not shown in device form
- #2132 System type does not change directly
- #2113 Can not download installation files for unmanaged telegraf (svchecks, telegraf)
- #2168 Creation of output plugin produces wrong url for the snagview server
- #2046 Device editor closes on save when entries are faulty
- #2151 Execute Config - database field is to small
- #2164 Image already exists, if name not changed
- #2122 Creating a telegraf template does not save values for "send timeout" and "flush interval"
- #2160 Filter Error: "Unknown column 'device.id' in 'WHERE'"
- #2060 \n not interpreted as newline break
- #2181 New created sensor do not leave pending state
- #2108 Automation history shows only a maximum of 50 objects
- #2072 Missing help for "telegraf version" and "svchecks version" in form "create telegraf"
- #2174 Search result not visible copying performance graph configuration
- #2136 Can not assign image to device template
- #2090 No character limitation for "Frequency" and "Max" in Actions
- #2094 The telegraf port should only be integer
- #2133 Performance graph line is incorrect if sensor switched back and force between telegrafs
- #2093 Negative numbers for sensor, metric buffer/ limit are allowed
- #2078 Telegraf - Agent configuration: Field "metric buffer limit" will be validated only on saving
- #2150 Dashboard home-view buttons not working
- #2087 Header Key help text has wrong character limitations
- #2008 Migrationtool - wrong parameternames with underline
- #2104 Notification escalation cannot read time periods with empty days
- #2128 False message "This field is required" for name if creating sensor from sensor template
- #2075 Missing validation for telegraf install and command paths
- #2019 Filter does not work in bookmarks
- #2067 Missing "Method" in webhook execution breaks execution list view
- #2105 When creating a telegraf template defined users and teams are not persisted
- #2091 Missing timeperiod is not intercepted properly
- #2118 Complex filters (e.g. comparison of “state” and “startup_mode” for metrics of Windows services) cannot be created
- #1842 The sort selection field for filters shows non-matching options for sorting
- #2103 "Home View" can not be empty
- #2030 The “Home View” in User Settings does not allow a '%' or '?' char
- #2050 Recovery message is send even if deactivated
## Internal
- #2167 tributejs repository is gone - frontend can not be build any more
- #2035 Implement command cypress tests
- #2040 Implement tag cypress tests
- #2037 Implement sector cypress tests
- #2042 Implement timeperiod cypress tests
- #2038 Implement sensor cypress tests
- #2043 Implement vault cypress tests
- #2041 Implement telegraf cypress tests
- #2034 Implement approval cypress tests
- #2036 Implement device cypress tests
- #2039 Implement sensor template cypress tests
## Performance-Graph-Dashboards for detail views
- #1953 Copy perfgraph configuration
- #1950 Implement Perfgraph-Dashboards
- #1946 Gather available metrics without sensor or device
## Features
- #1897 Add feature to convert a device to a devicetemplate
- #1235 Make showing timestamps as "x mins ago" configurable
## Improvements
- #1588 Show a message after license change, if automations, etc have been disabled
- #1846 Delete availableMetrics if command of sensor is changed
- #1974 Focus the first input-field of modals and the search-field of the overview when they are shown
- #1850 It should be possible to define device sensor at the device (and not at the sensor)
- #1050 Display images for devices in SNAG-View 4
- #1991 Application of templates should be restructured in the assistant
- #2082 Focus first input field in forms
- #2066 Add scheduled time planning block to issue templates
## Bugs
- #2129 Mails are also sent at times that are not defined in the time period
- #2063 Remove "License" from Help dropdown in sidebar
- #2101 Can not install telegraf in path with spaces
- #2126 Long metric field names overflow in perfgraph form
- #2121 Password for telegraf remote user is stored in plain text in table telegraftemplate
- #2052 Refresh interval resets execution config
- #2106 Tags missing in mass change for all objects except images
- #2100 Can't update user settings of external user
- #2102 User could not be created: name contains invalid characters "_"
## Internal
- #2092 Centralize AnyTime etc. helper functions for tests
- #2018 Add API tests for objects
- #2064 Add new vue dev-tools to repository
- #1663 Rework API Tests for Cypress
- #2017 Fix docker environment for automated tests
## Bugs
- #2101 Can not install telegraf in path with spaces
- #2100 Can't update user settings of external user
## Performance-Graph-Dashboards for detail views
* [ bug ] #1954 All tag combinations are combined into one single line
* [improvement] #1624 Copy with wildcards
* [improvement] #1949 Redesign Perfgraph-Widget-Form
## Improvements
* #1927 Refresh counter should count down instead of up
* #1934 Switch repository check to required list
* #2004 Missing "create"-Button in device detail-view's sensor tab
* #1983 Starting SNAG-View should be create the tmp folder if not exist
* #1932 Add copy button to token toast
* #1898 Display sensors per telegraf in sector view as fill meter
* #1988 Insert license via --license flag
## Bugs
* #2096 When installing Telegraf on Windows, the default path for telegraf.conf is always used for service
* #2089 Wrong parameters after saving telegraf template
* #2054 Import config fails if tmp folder in SNAG-View install folder does not exist
* #2056 Status-Widget preview does not refresh when switching to "sensor"
* #2088 Create Telegraf from template ends up in wrong parameters for created Telegraf
* #1957 Can not change device sensor for device template
* #2071 Rating is not correct evaluated if field is a float
* #2084 For unmanaged telegraf templates authentication method will be displayed in telegraf template list
* #2053 Browser creates too many requests on first load
* #2058 Frontend consumes lots of memory
* #1977 Can´t update frequency and timeout at the same time
* #1924 Diagram statusrefesh error
* #1421 Tooltip and click box is wrong if diagram is zoomed
* #1908 Objects "diagram" and "diagram template" missing in mass change
* #2031 Opening Browser from status widget does not copy widgets filter
* #1958 Option "active: true" from template will be ignored creating devices from API
* #1978 Frequency and Timeout from Sensor Template update after saving a Sensor
* #1726 Frontend should not use UTC time
* #2069 Can not change custom field of sensor
* #1976 Parameters of sensor templates disappear when creating a device with a device template
* #1972 Parameter value shouldn't be mandatory for a command parameter
* #1981 List size limit of 200 entries ignored by API
* #1990 Query for filtering device state does not work correctly
* #1760 State interpretation fails and returns unknown if more than one metric matches the interpretation filter
Highlights
- Two factor authentication
- via OTP - use your favorite authenticator app
- Server configuration moved to database
- most of the snagview.ymls content is now inside the database
- Configure SV4 conveniently in the frontend
- Export a server configuration via frontend to a config.yml
- Import a server configuration file with the new --config binary parameter
2FA - Two factor authentication
- #1883 - 2FA backend implementation
- #1884 - 2FA frontend implementation
Make server configuration editable via frontend
- #1887 - Implement binary argument to import a YML as server configuration
- #1886 - Implement new editable server configuration detail view
- #1885 - Implement API to view and edit server configuration
- #1998 - Standardize the names of the keys for the configuration
- #1967 - Add possibility to backup configuration from frontend
Define "user settings" and store these settings per user permanently
- #1888 - Store user settings (general and list settings) inside the database
Add more actions to mass changes
- #1683 - More options in "Mass change" for sensor templates
- #1536 - Add "Enable/Disable" in masschange for automations
Features
- #1663 - Rework API Tests for Cypress
Improvements
- #1926 - Implement filters for 'check_message' and 'check_time'
- #1806 - Prevent deletion of images while in use
- #1925 - Proxy Telegraf: If sector is not explicitly selected, home sector should be used
- #1857 - Add support for Ubuntu 24.04 to repository checks
- #1801 - Remove some options for unmanaged telegrafs
- #1829 - Add "<=" and ">=" as operators for ratings
- #1861 - Improve help text for rating field "name"
- #1794 - Remove "edit" and "delete" buttons for all system objects
- #1807 - Save text in diagram text field automatically on exit
- #1881 - Make telegraf / telegraftemplate available in form for creating device
- #1847 - Action "sensor delete" is not available for sensor in burger menu
- #1802 - Change name of 'Value' in Vault Entries
- #1880 - Expand tooltip of Execute Config
- #1874 - Add telegraftemplate to form “Create"
Bugs
- #1986 - Password fields for config entries are validated in frontend
- #1959 - Notification Rules not displayed and written into influxDB
- #1975 - The backend is too strict in validating fqdn strings
- #1782 - Can't export sensor
- #1985 - SQL query for check*- filter (status filter) attributes is broken
- #1902 - Field "runtime" is empty
- #1716 - Inconsist displaying changed/created time in SNAG-View
- #1928 - Refresh counter for detailviews does not work
- #1909 - Filter "not" is not working with tag_name
- #1915 - Browser won't be refreshed after deleting object (device or sensor)
- #1989 - global configuration validation is problematic
- #1969 - A new user cannot be created, json error field "locale"
- #1910 - License ending text is not readable
- #2003 - Automation is not displaying/saving added Sensors in rule
- #1912 - svchecks version in database will not be set after installing svchecks
- #1917 - Can not create role with user(s)
- #1916 - Can not create rating for sensor with nagios command for perfdata
- #1911 - API endpoint for downloading repositories does not work as expected
- #1491 - LDAP Sync mark user with duplicate Role or Approval, import not possible
- #1919 - Telegraf is flagged as installed when installing only svchecks via api
- #1890 - Can't create device with telegraf
- #1973 - Link to user documentation leads to non existing pdf
- #1901 - Telegraf auto-install does not install telegraf
- #1789 - Tags not shown in command list
- #1818 - Cannot create rating without all interpretations
- #1873 - Proxy telegraf can not be chosen from dropdown list
- #1879 - Filter attribute "author" is missing for device template
- #1877 - Wrong help for field "name" of telegraf template
- #1758 - API: Wrong success message when installing svchecks for single telegraf
- #1875 - Can not change command path for not installed and managed telegraf (Windows)
- #1876 - Form "telegraf" wrong after deleting telegraf
- #1837 - Sending a mail with the macro ACK.MESSAGE does not work
- #1900 - Field "Telegraf Template" diplayed as required field when creating new telegraf for device
- #1904 - Fix error message when creating new tag
- #1800 - Inconsistent way of deleting image objects
- #1859 - Change link on login page
Bugfix-Release
Release date: 2024-08-12
|
improvement
|
Add support for Ubuntu 24.04 to repository checks |
|
bug
|
All telegrafs get the same checksum |
Bugfix-Release
|
bug
|
Can't add users to rules |
API Documentation
-

