About Vision
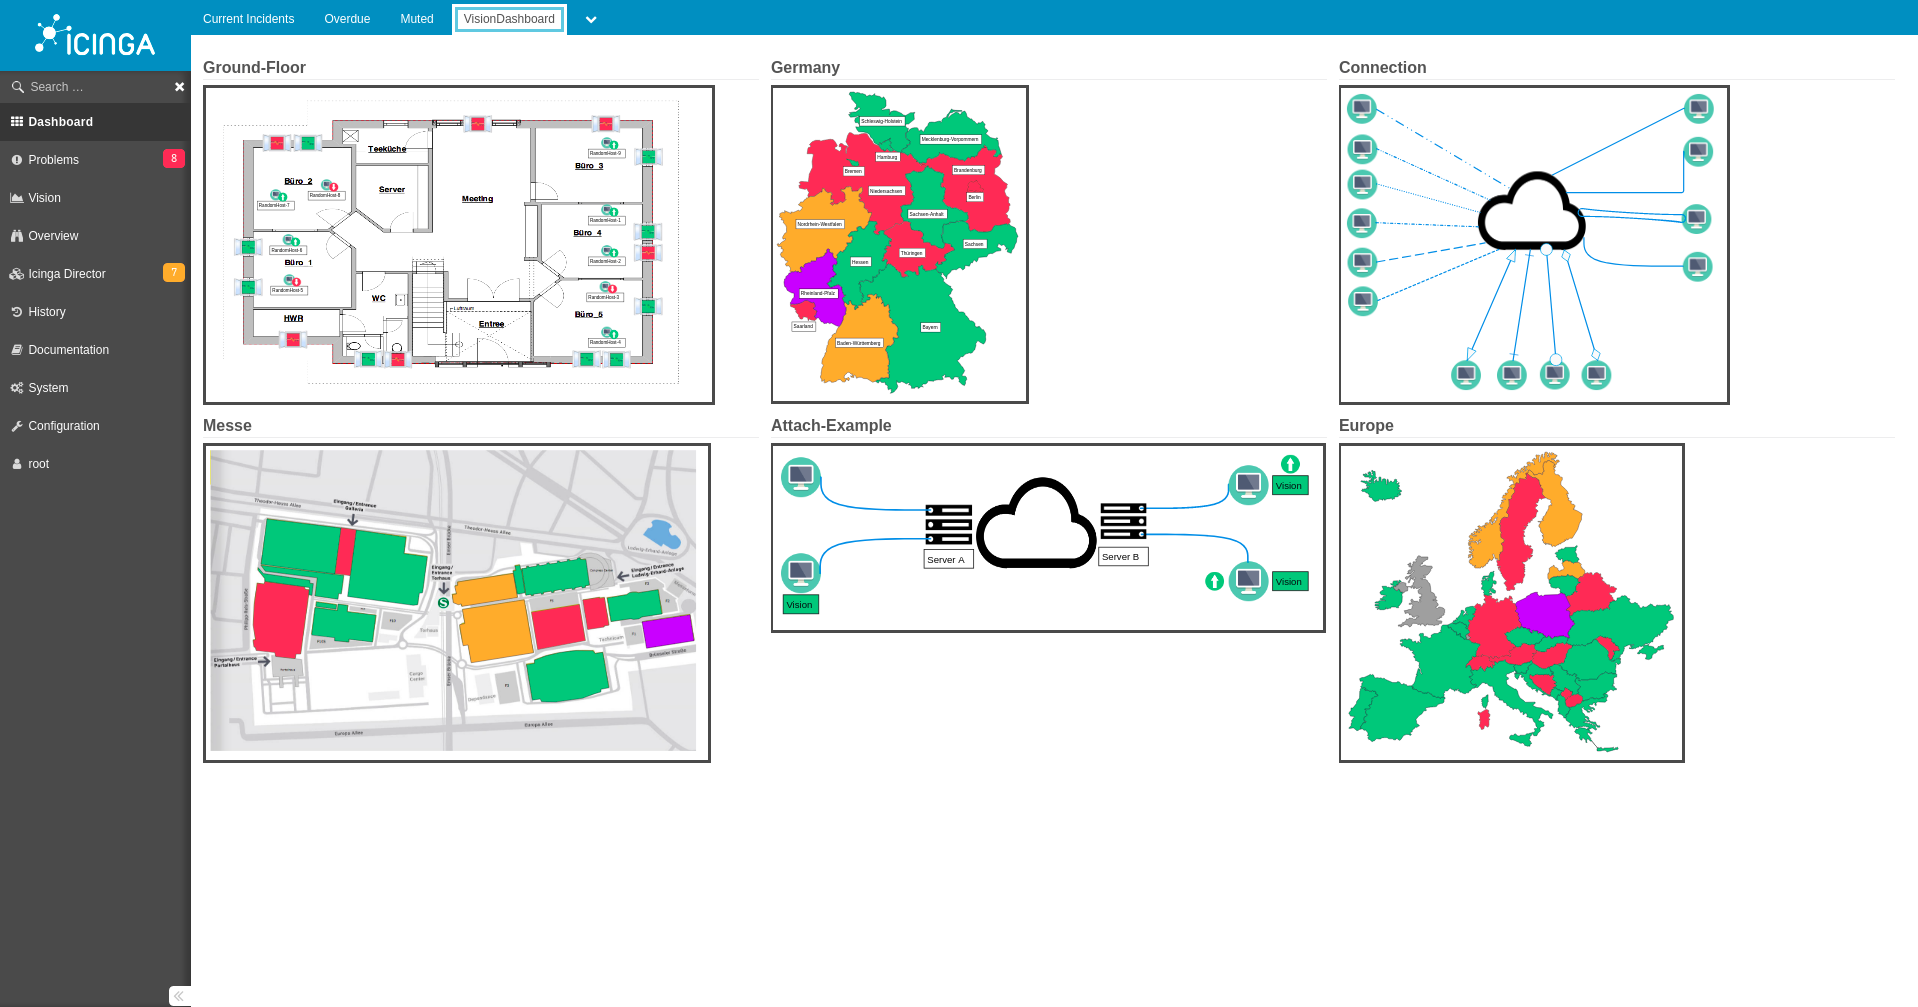
With "Vision" we have developed a module for the browser interface IcingaWeb2, with whose help you can easily create extensive graphics for your ICINGA2 monitoring. Due to the automatic filling with the appropriate status values you are able to convert the data available in Icinga2 visually and evaluate it much better. Vision serves as an editor for the creation of so-called diagrams, which you can design as you wish. Examples would be the world/ Europe map or the floor plan of your company building. These maps can be extended with the live status values provided by Icinga2. Vision allows you to place hosts and services on the chart according to your needs, allowing you to see problems or failures at a glance. Diagrams created can also be displayed as widgets on your dashboard.
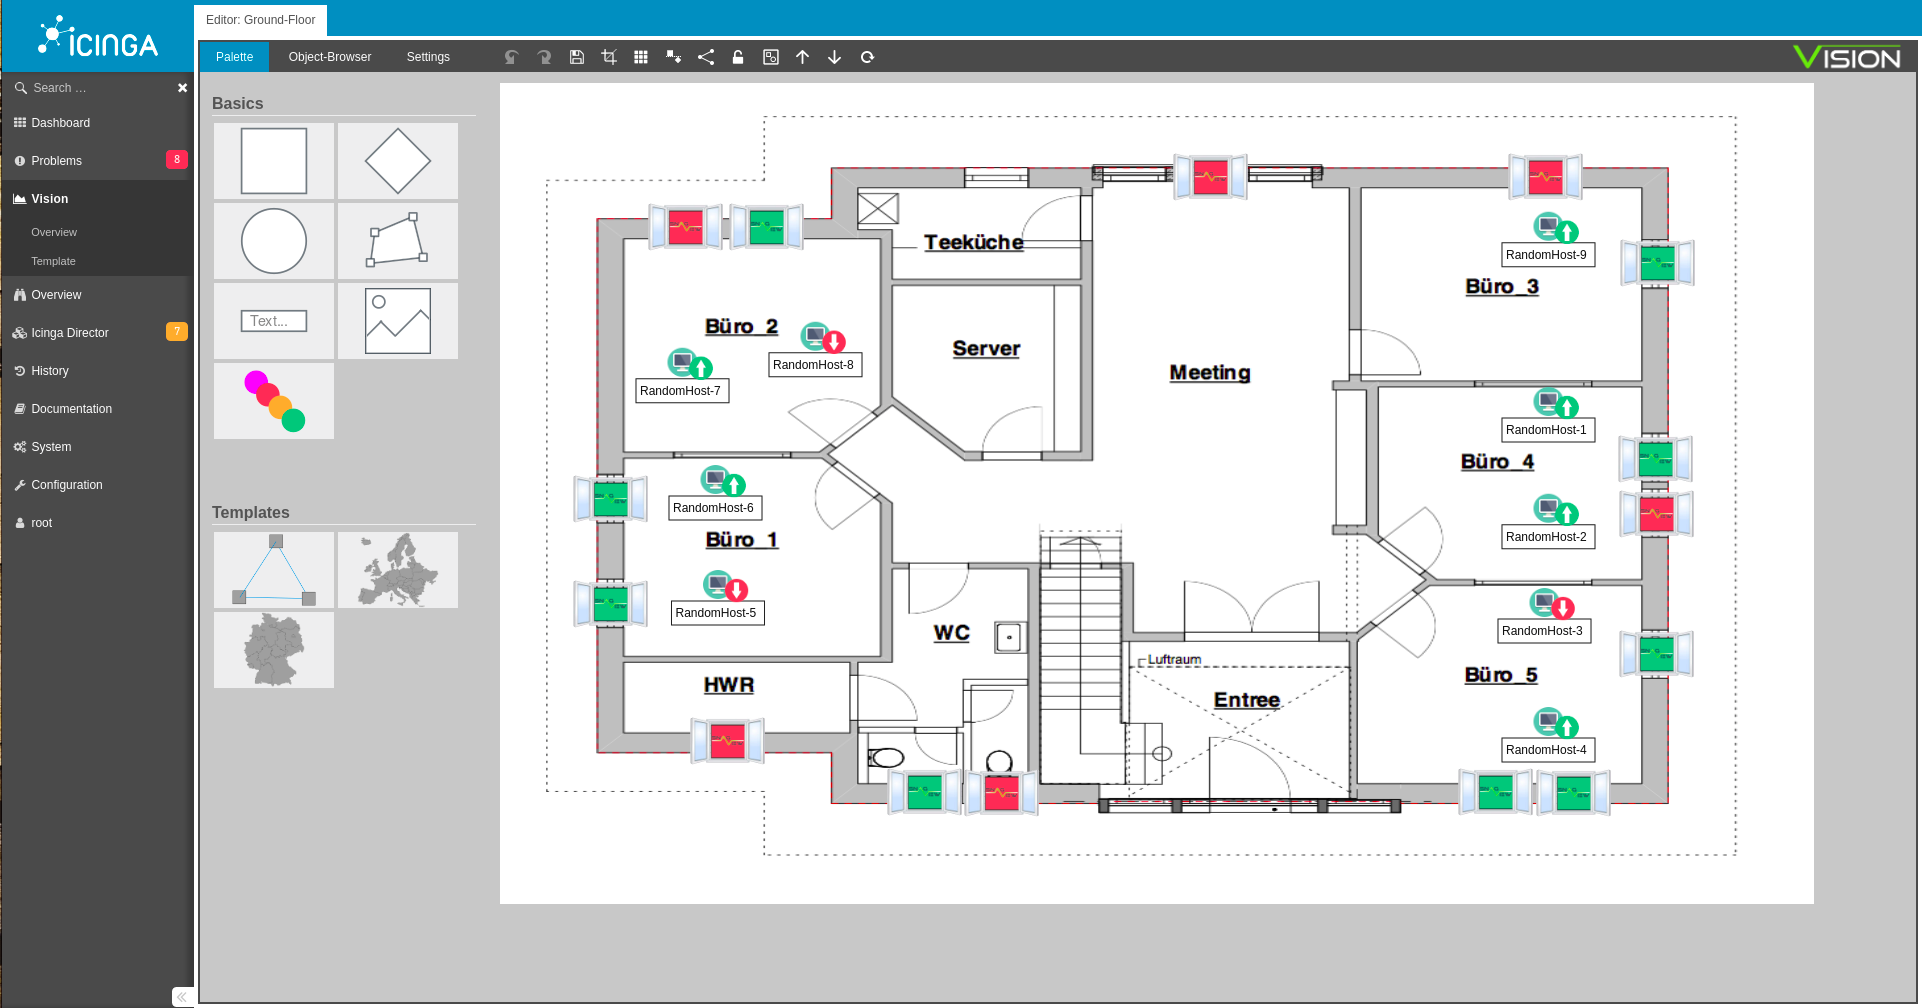
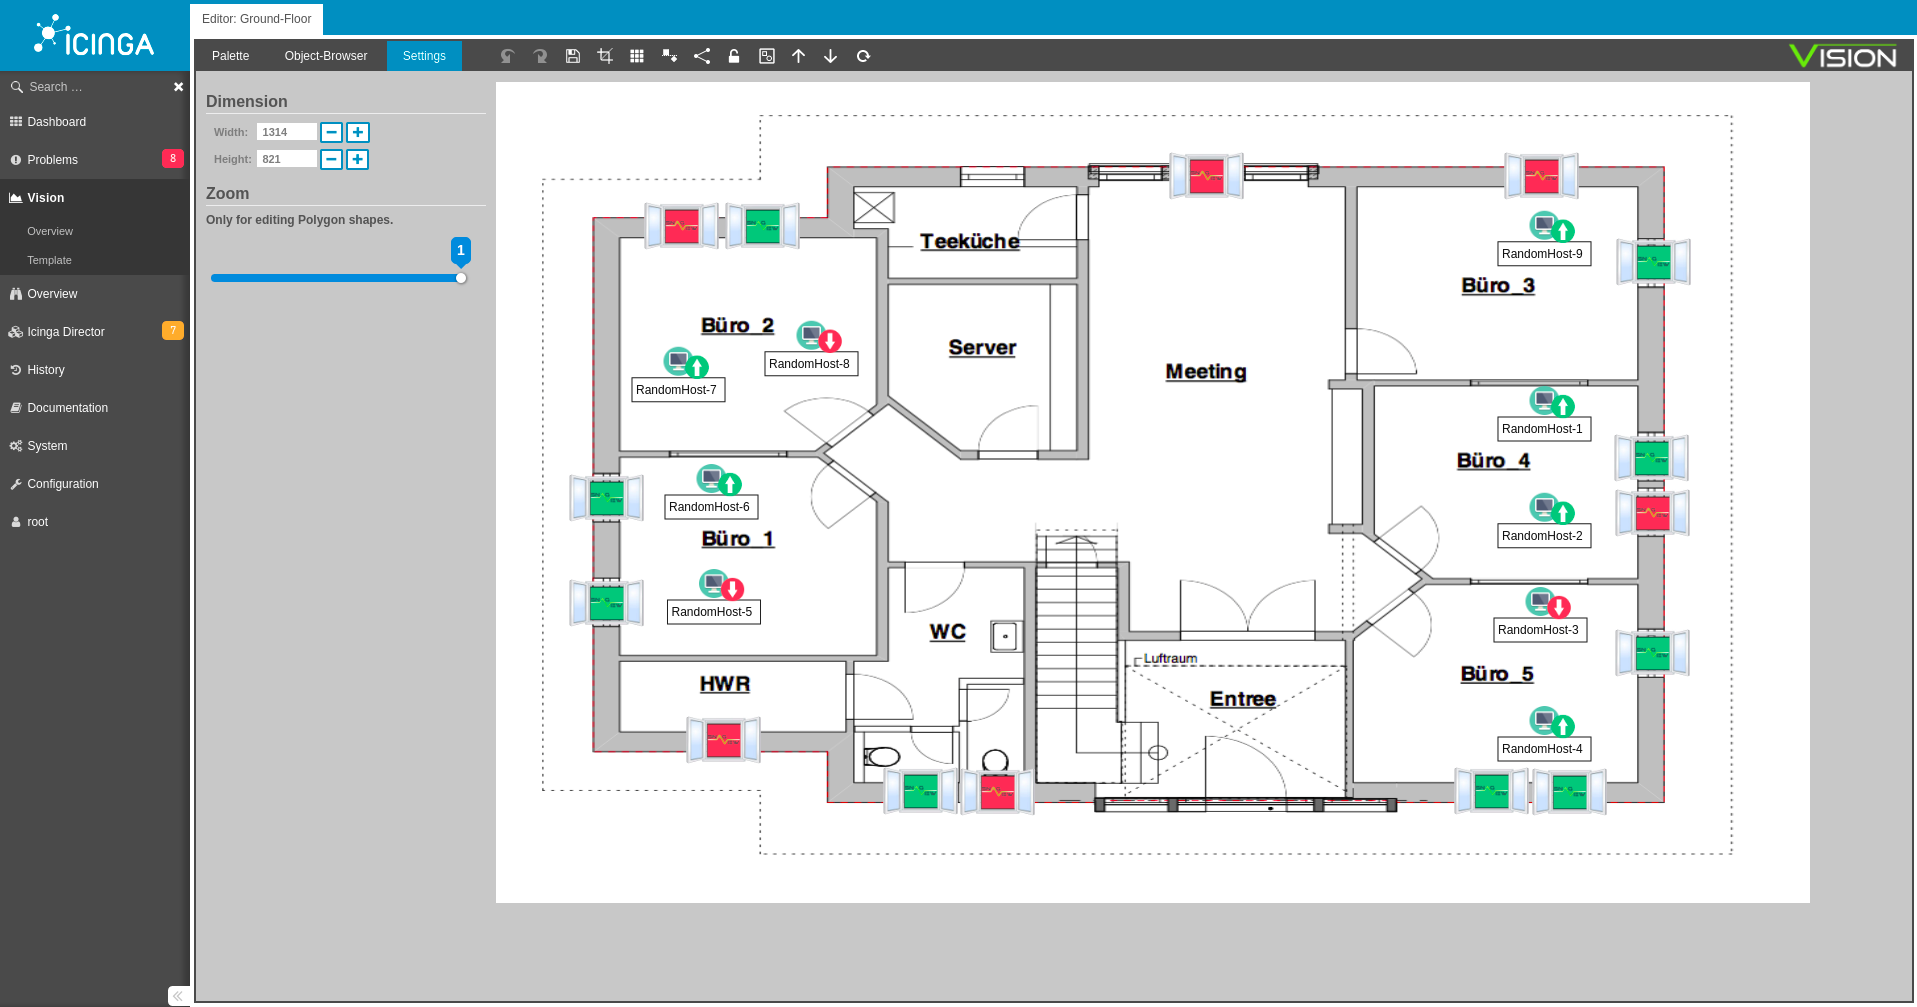
Editor
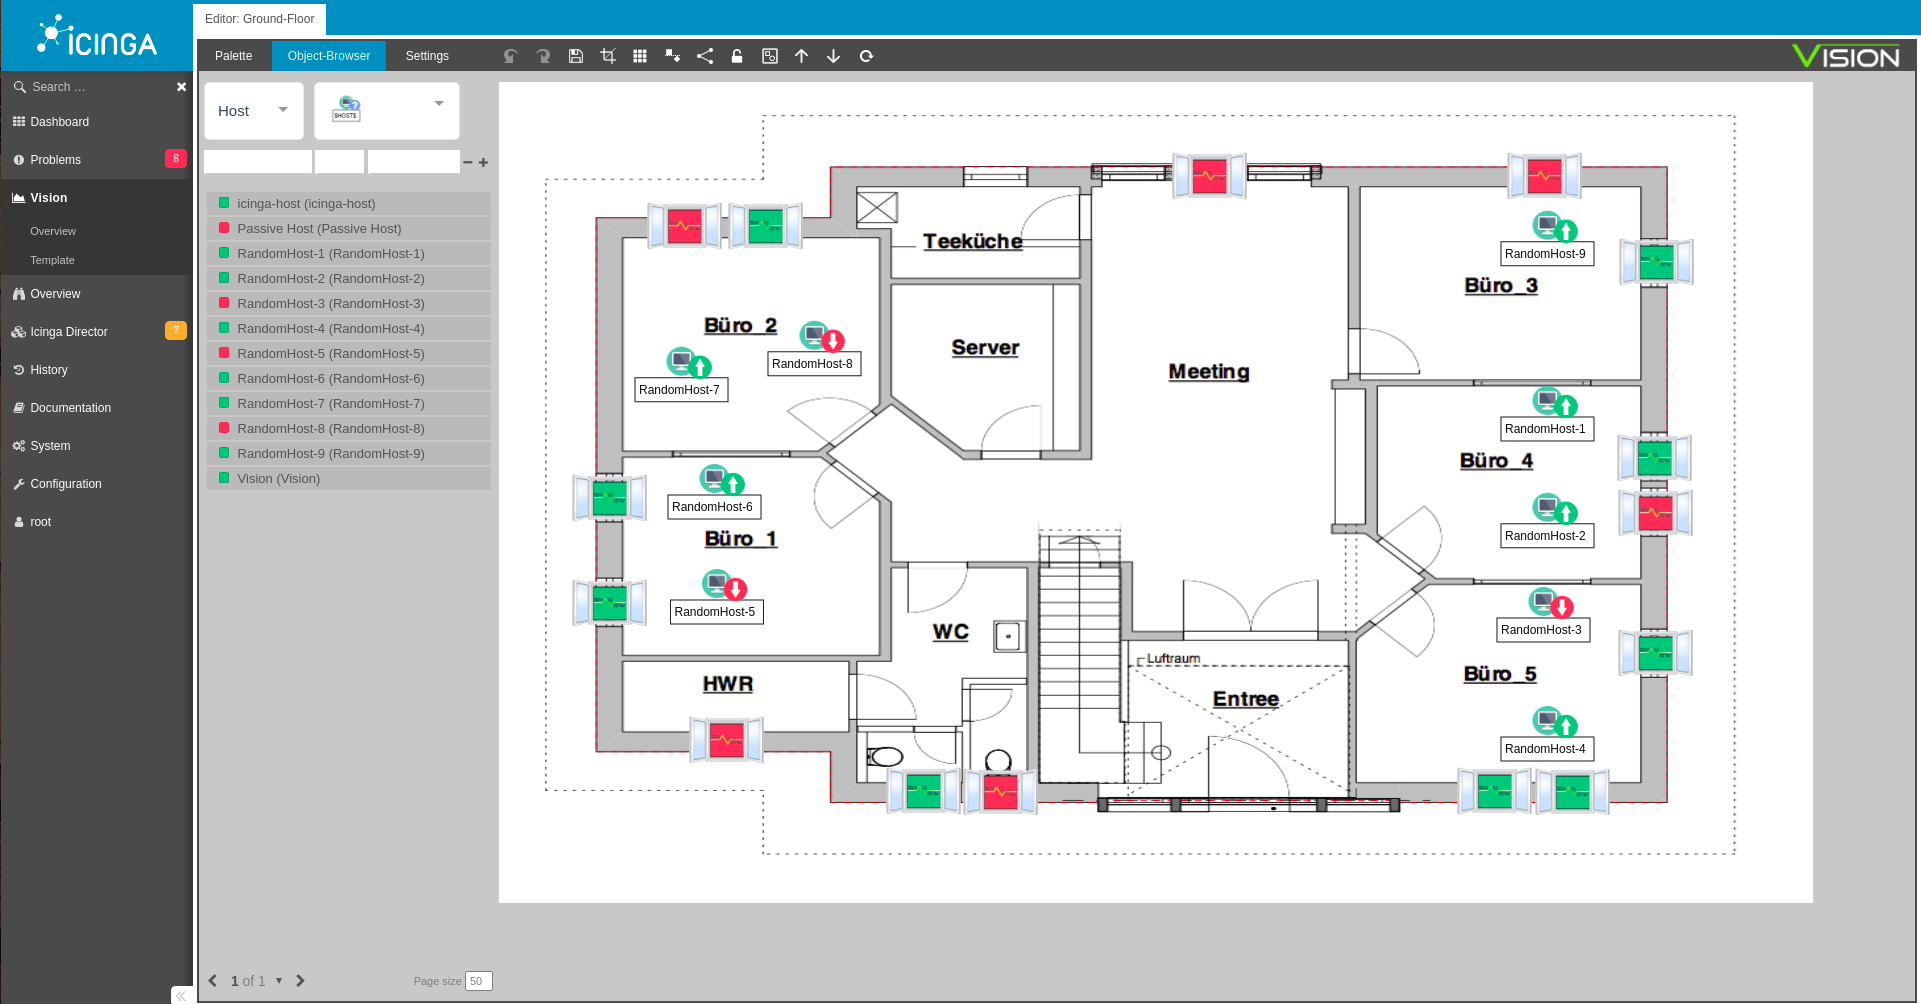
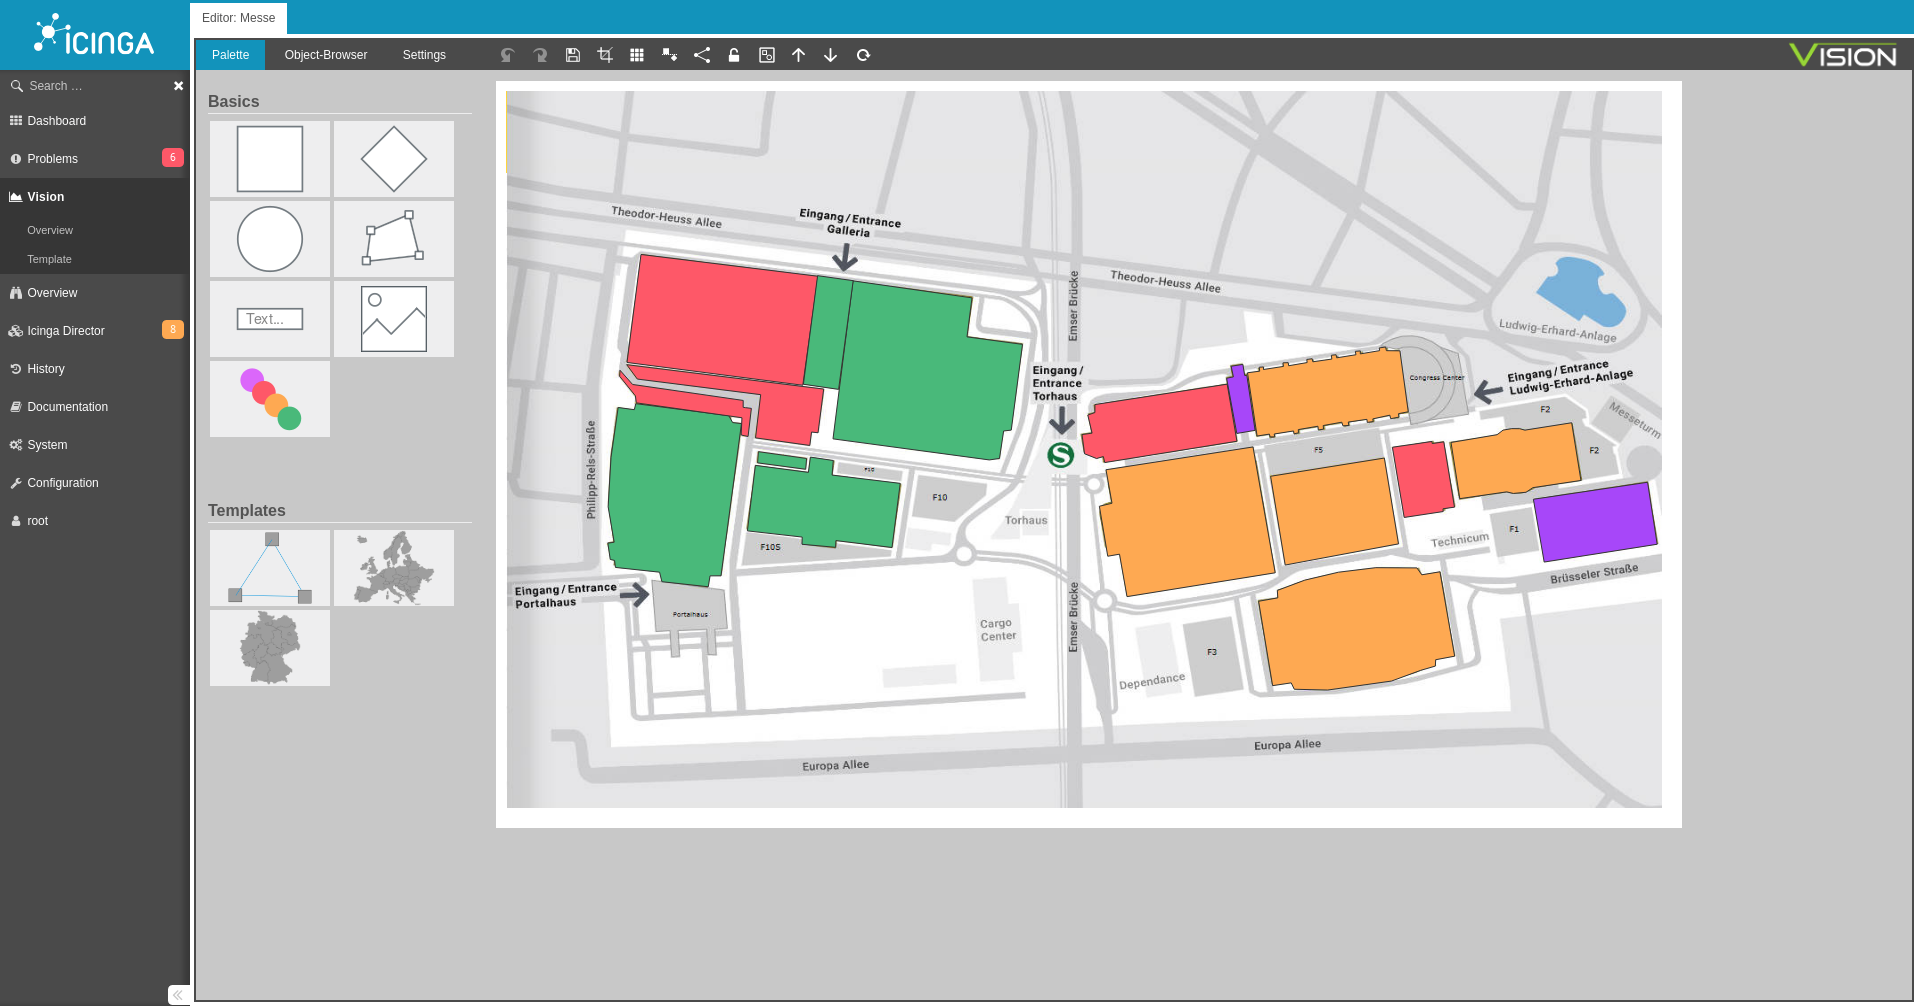
The editor is the basis of Vision, it allows the creation of diagrams. The diagrams are maps/images on which the individual host and service objects are placed. With the help of the editor you can graphically display your IT infrastructure and thus see failures or problems at a glance.
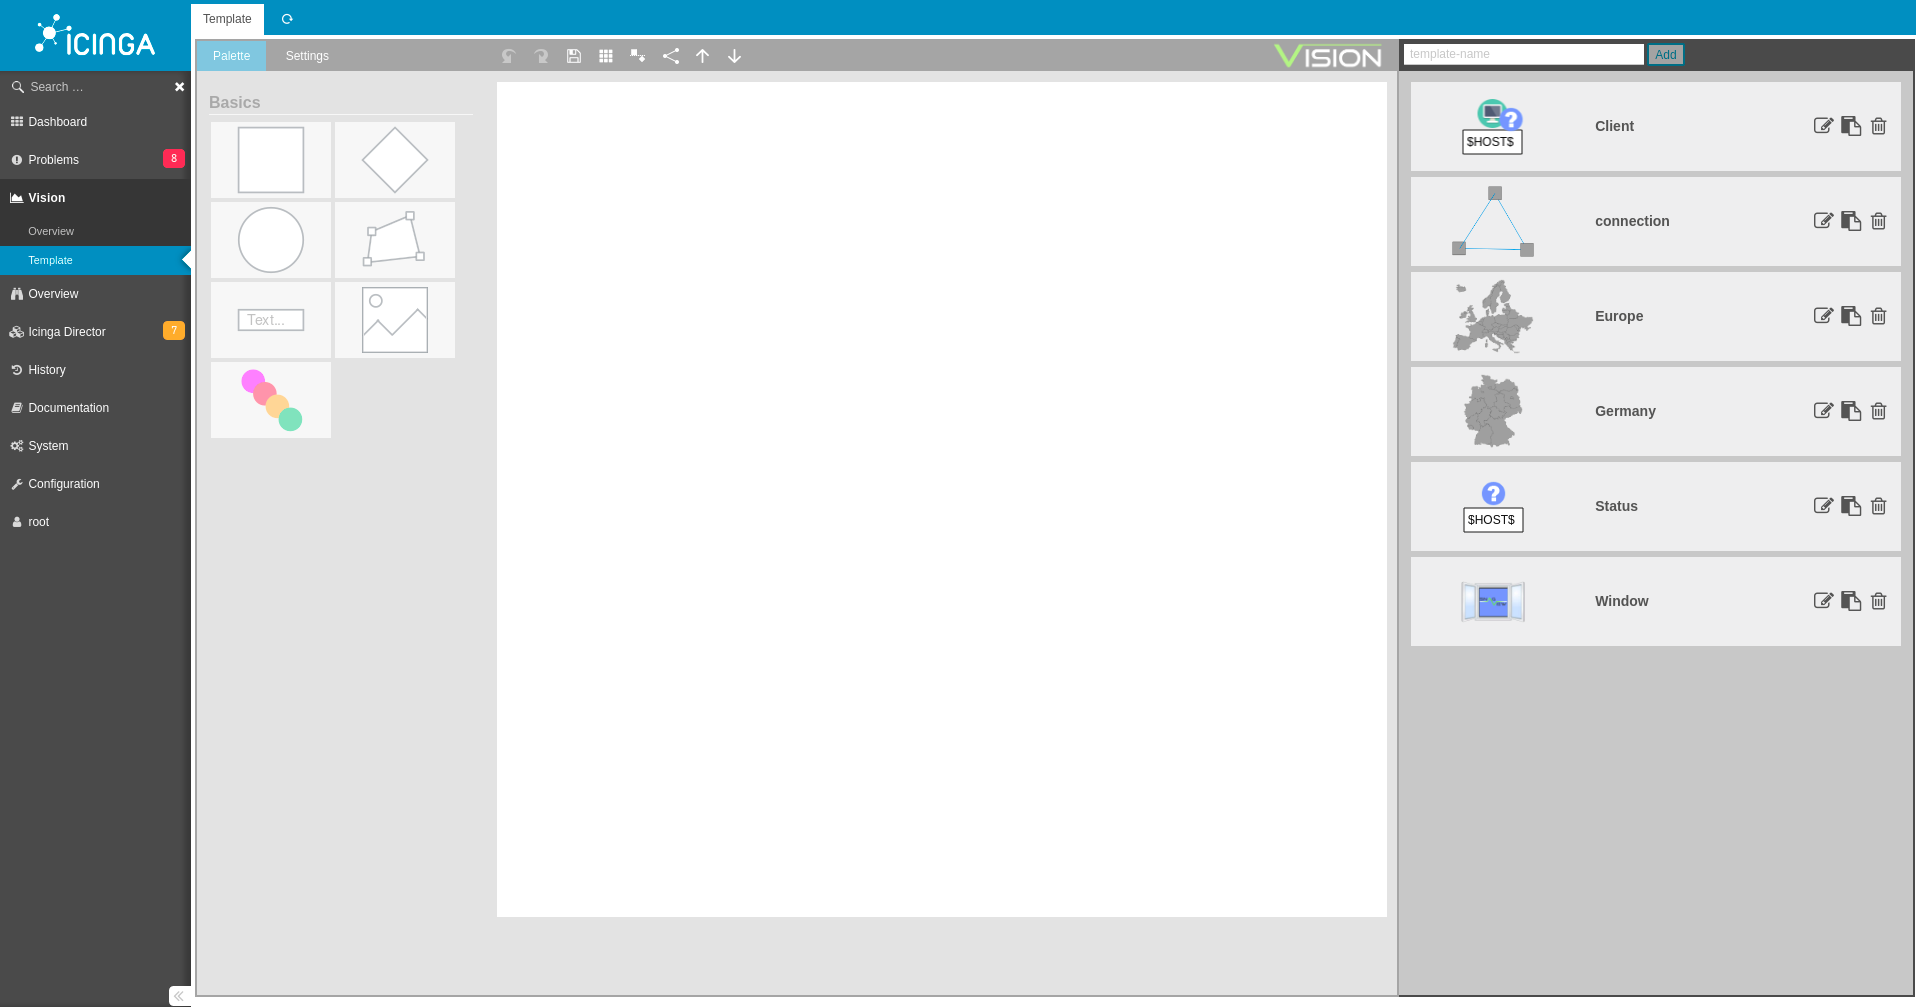
Vision Objects
The following objects can be used to create the diagrams:


Objects can also be merged into templates, see below.
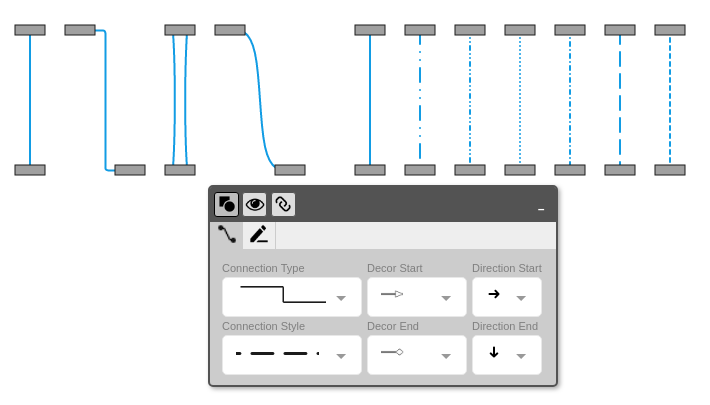
Connection
All objects and templates can be linked with connecting lines.
Linking hosts and services to objects
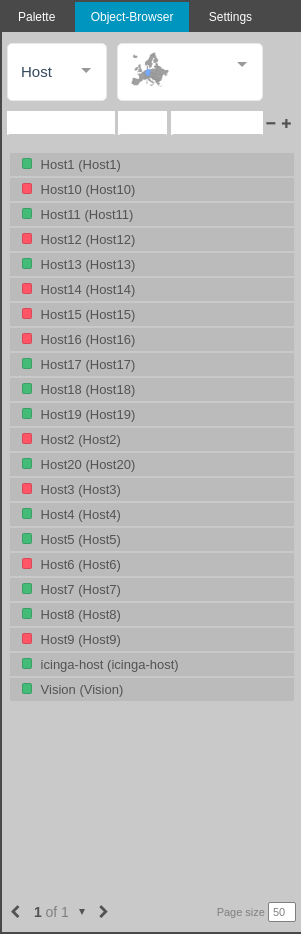
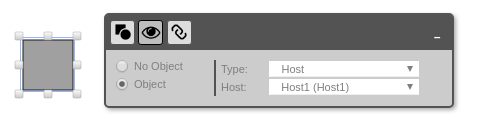
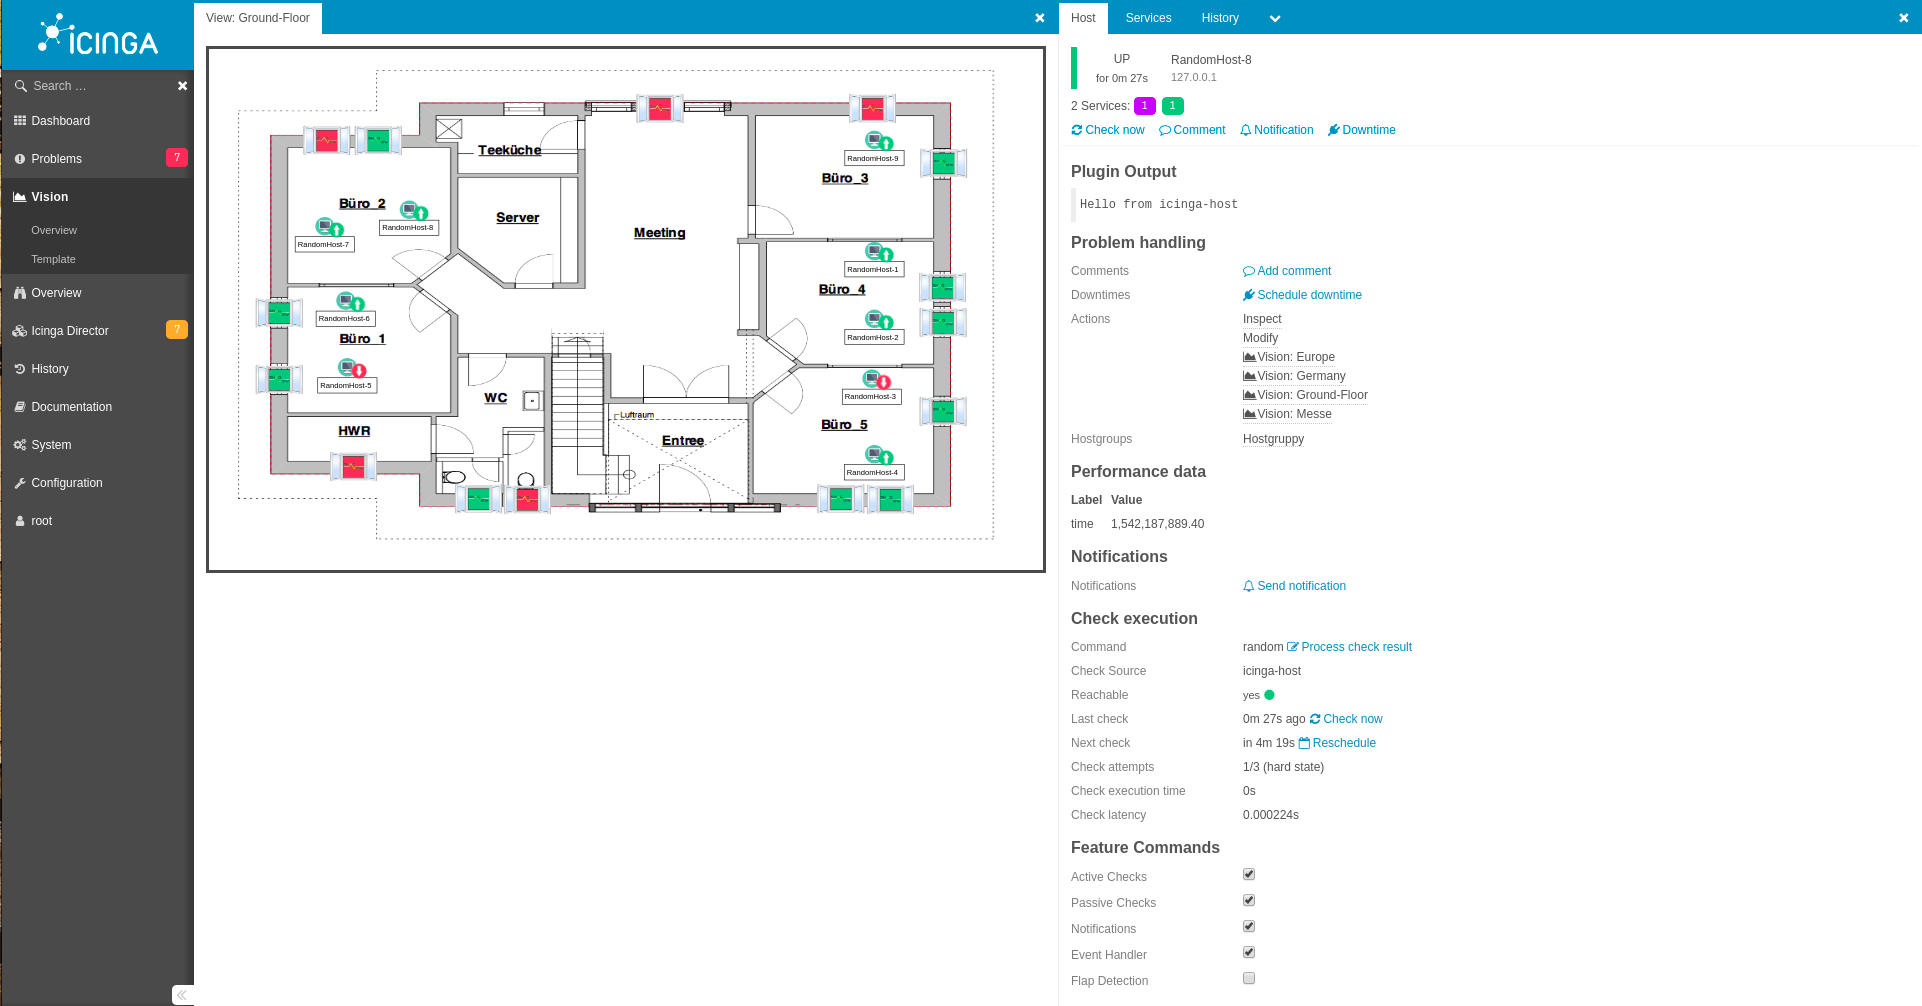
The core feature of Vision is linking objects and connecting lines to hosts and services. Hosts and services can either be placed on objects by dragging and dropping them from the Object browser, or they can be linked using the context menu. These objects always display the desired live status from the Icinga 2.
editing
The editor has many editing functions. Among them, it offers the possibility to adjust the canvas size to existing elements via a crop function.
There is a grid mode that displays an auxiliary grid and allows the user to align the objects with this grid. Furthermore, the editor has the function to group objects together, and the Undo/Redo function can be used to undo editing steps.
With the help of a front/back button, individual diagram elements can be lifted into the foreground or background.
Features
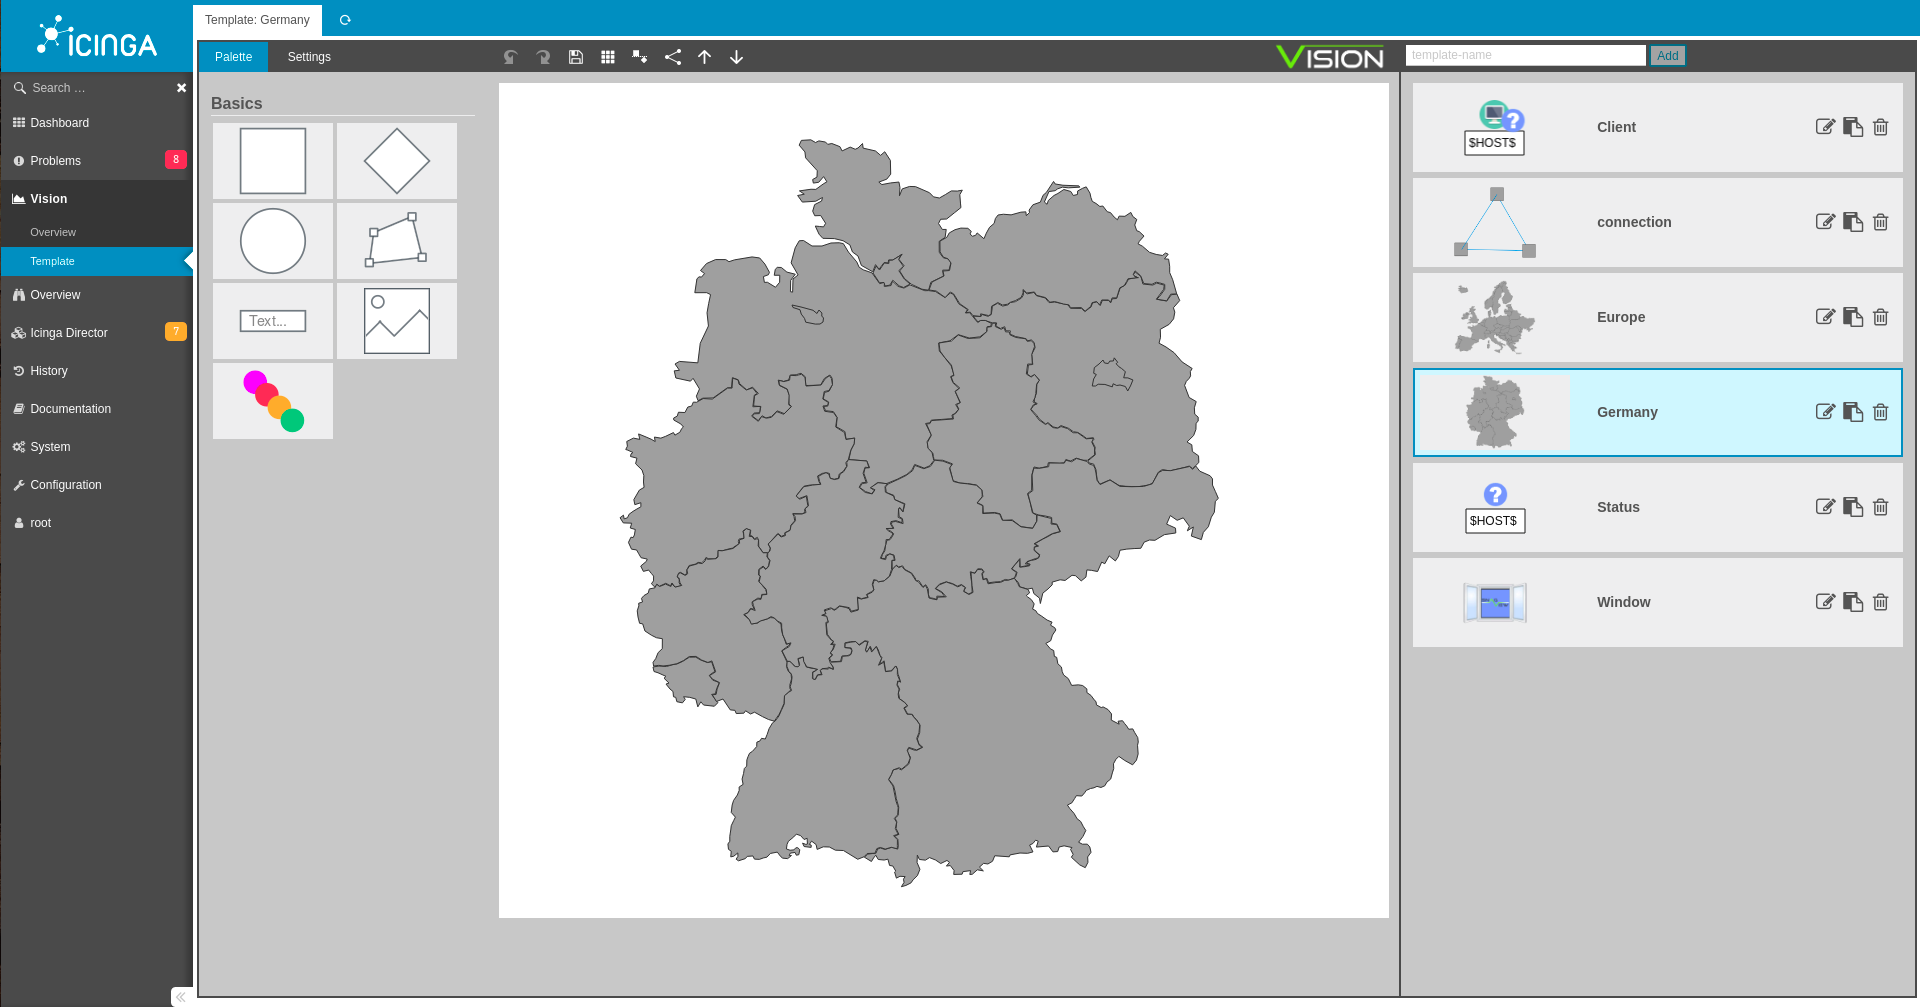
Templates
Vision enables the creation of templates. Templates are objects that consist of your own images or the objects of the palette. A template can be used as a template for the diagrams. Thus, Vision makes it possible to use objects once they have been created over and over again.

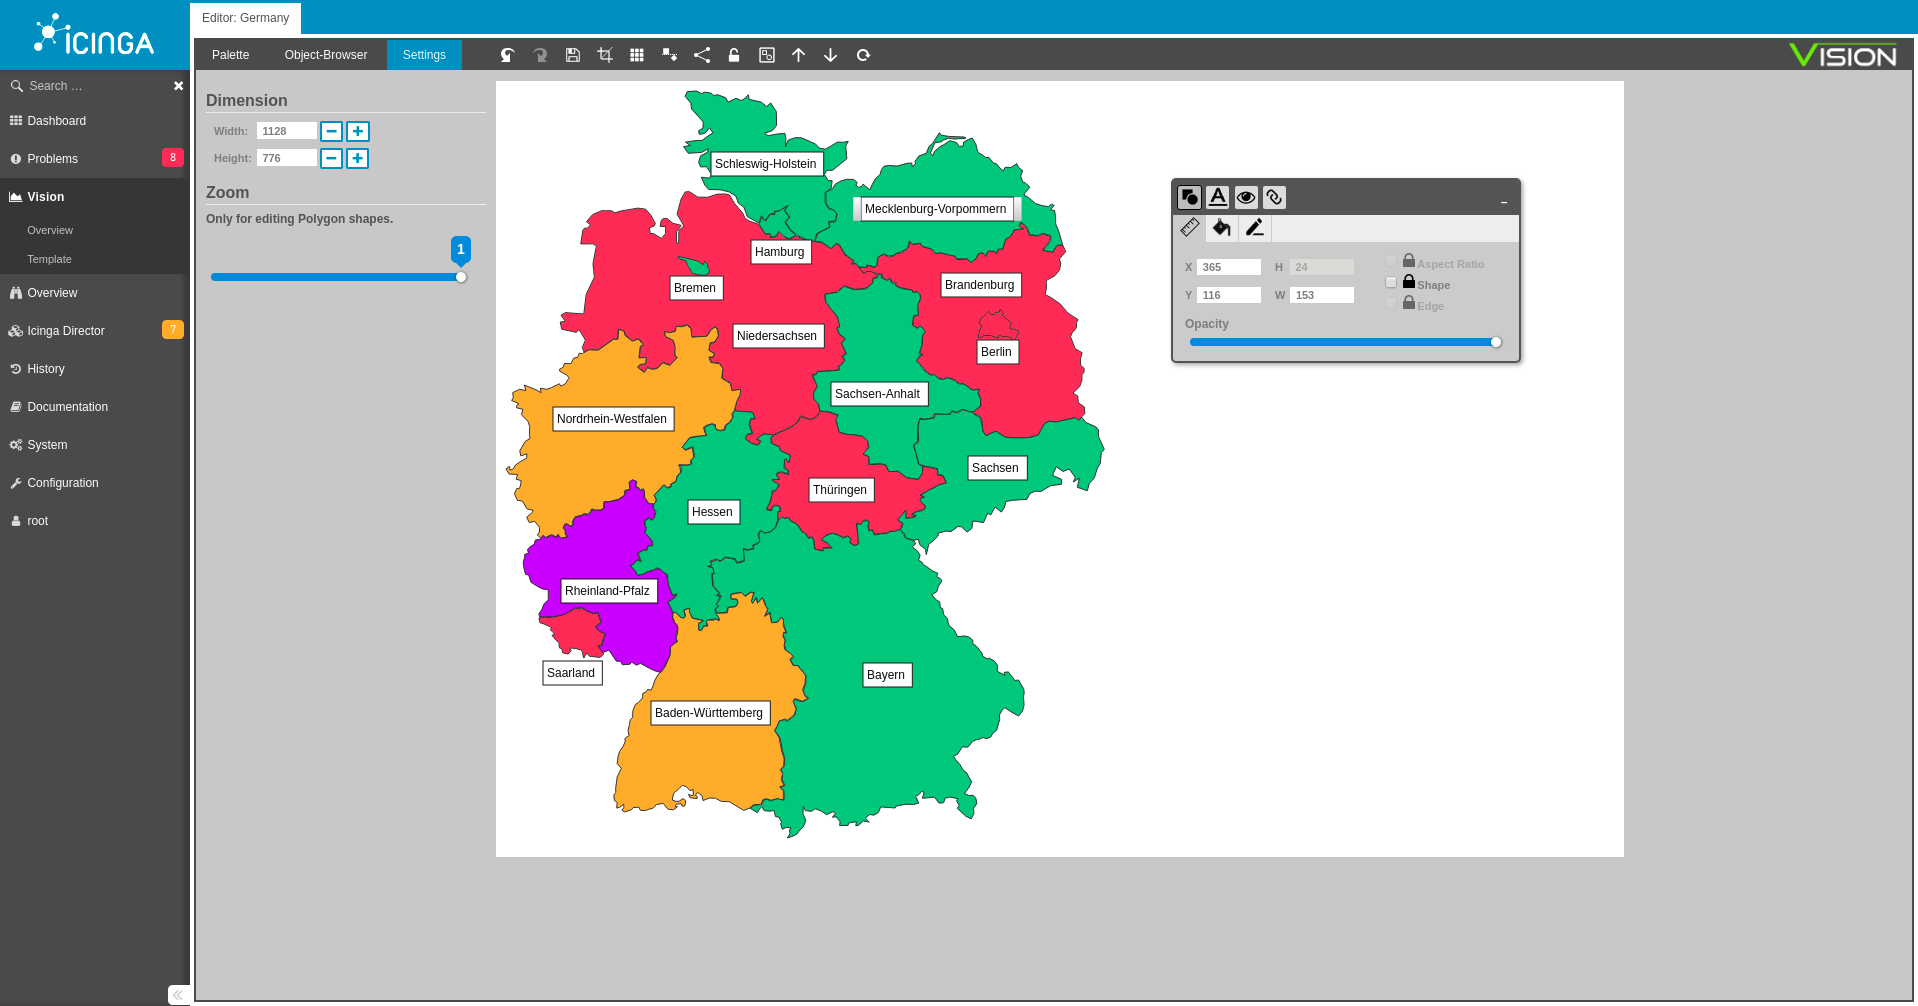
Customizable Polygon
The special zoom function for creating polygons in Vision makes it possible to display objects in great detail. These objects can later be filled with live status information and change their color according to the current status of the host, e.g. Up, Down, Unreachable, etc.

macros
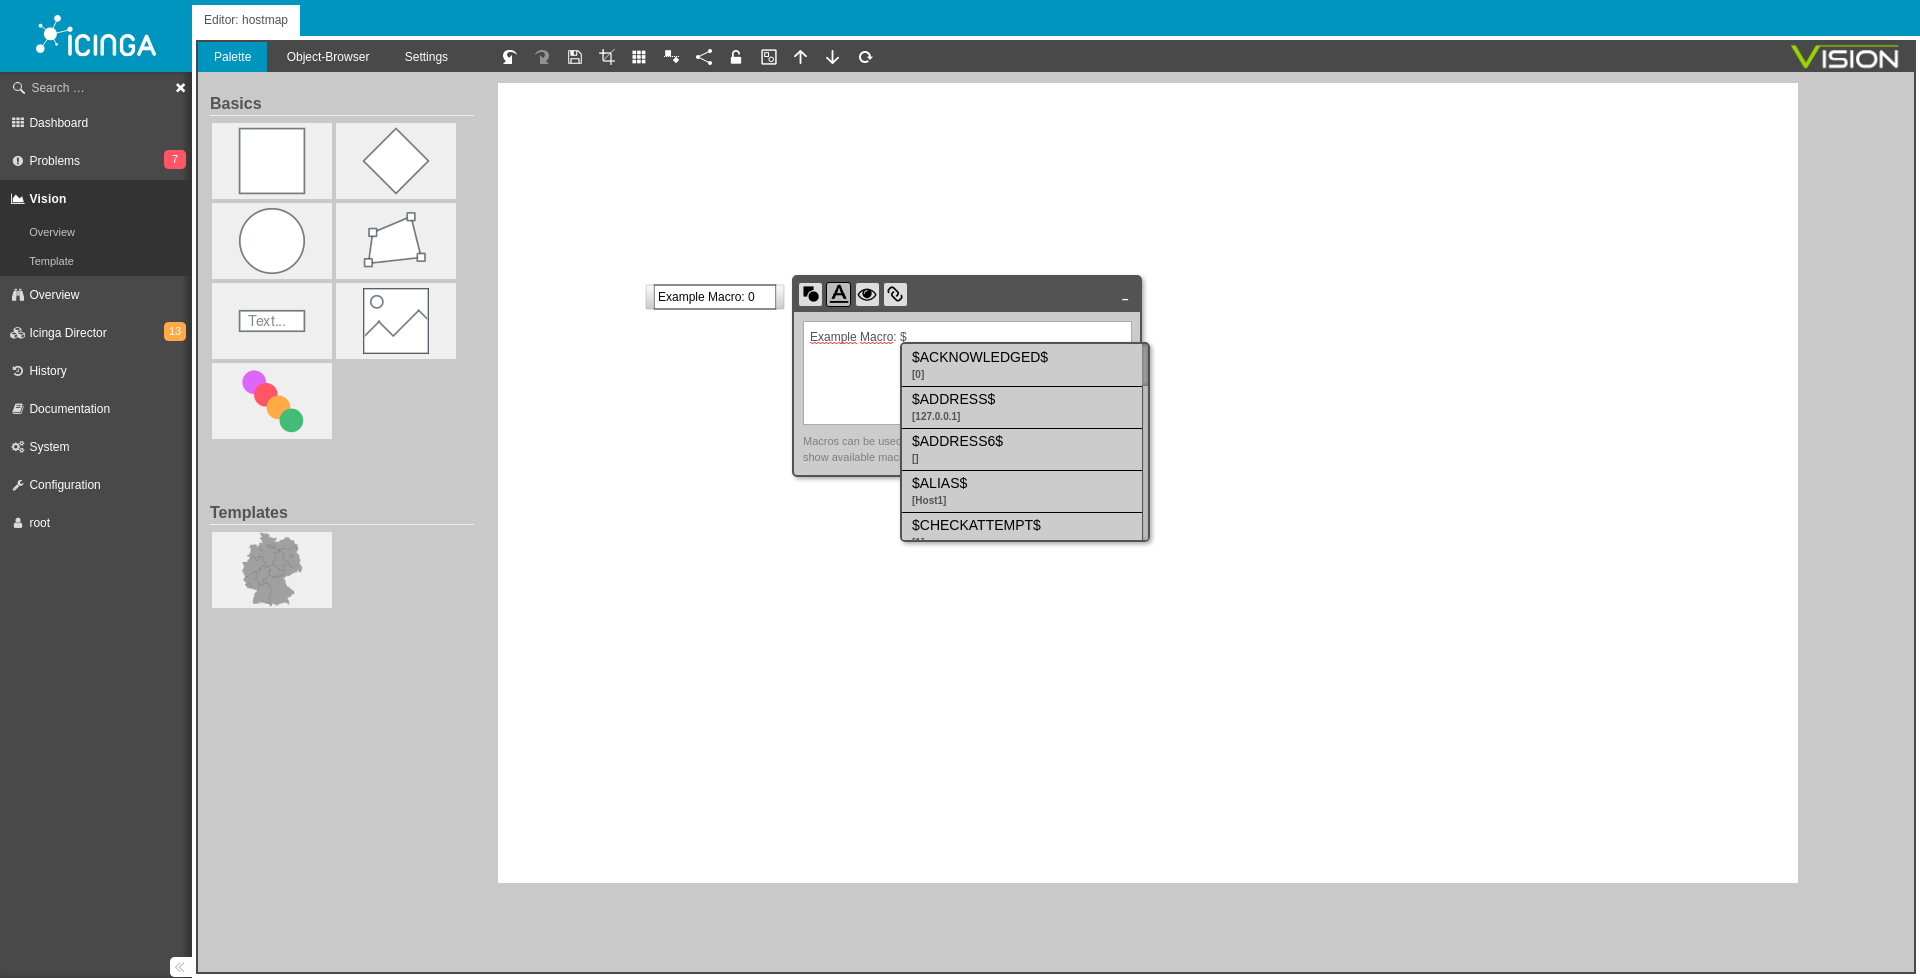
Each label (text field) can be given all information of the host about the input of macros.
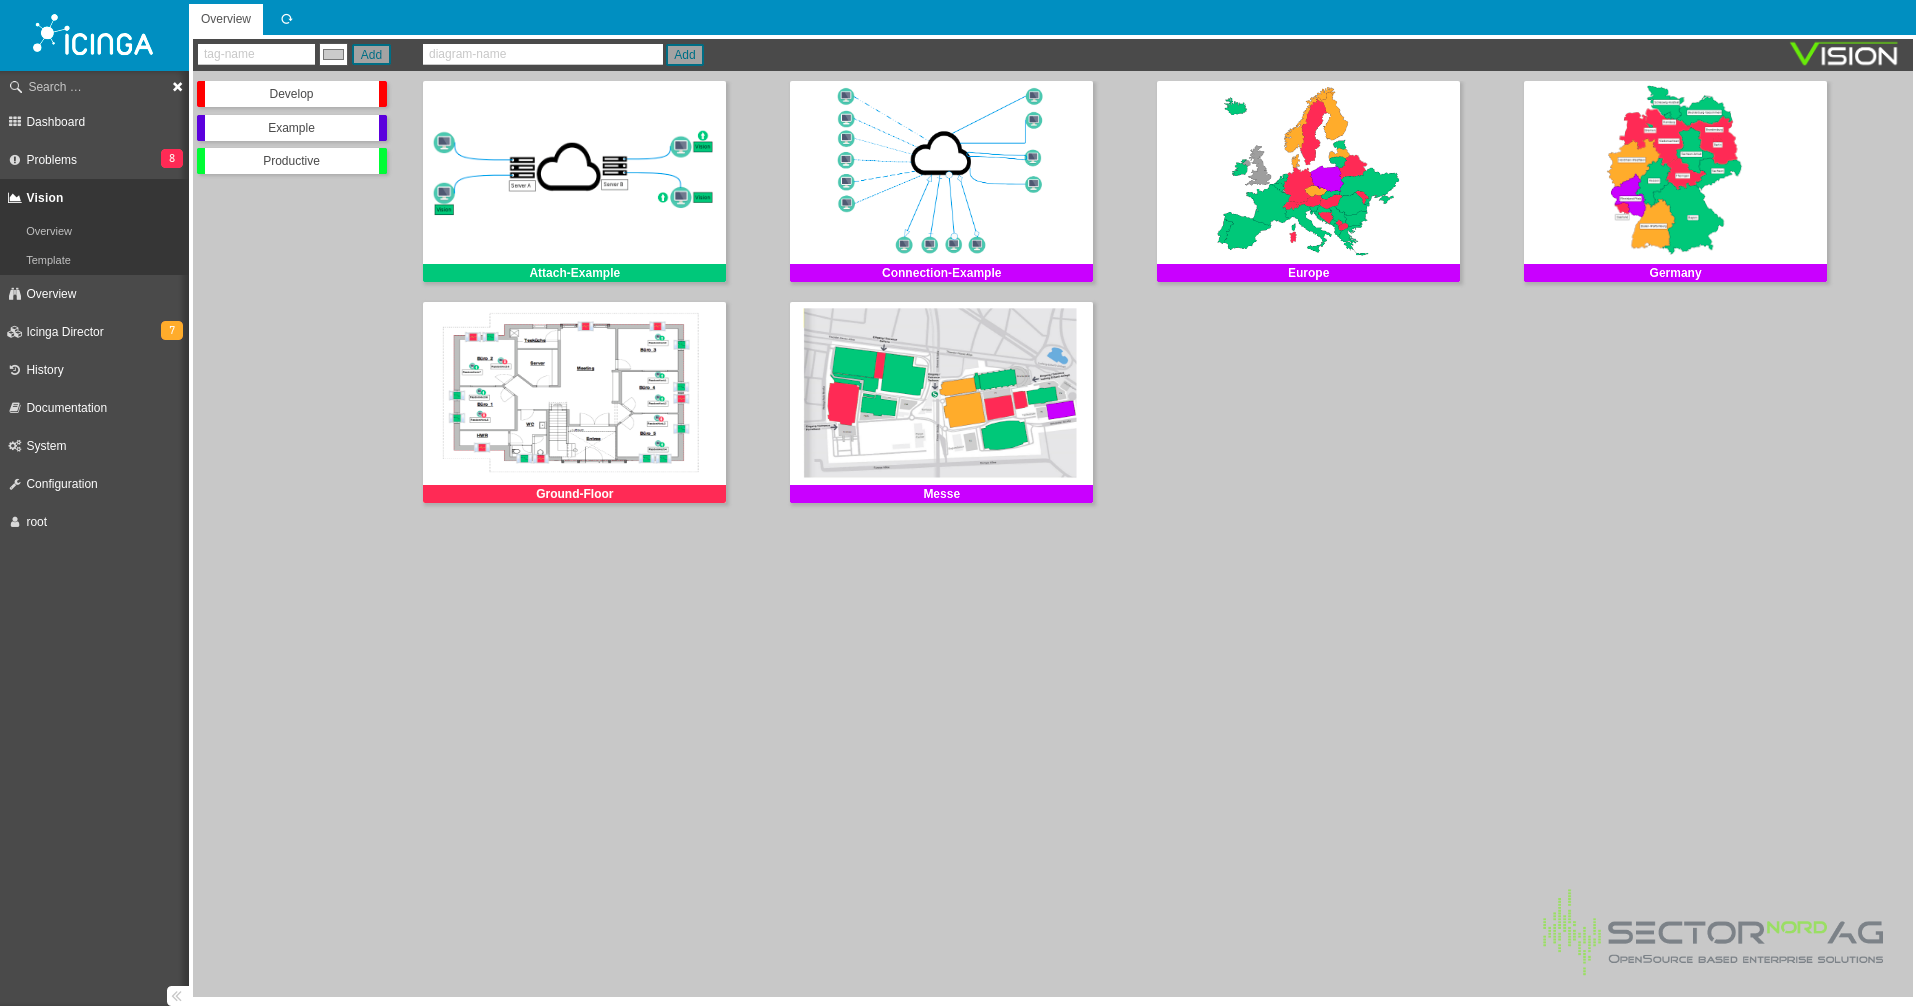
Tags
Diagrams can be tagged to make them easier to find or classify. These tags can be easily created using the tag list on the left and dragged and dropped to the diagram. In addition, this tag list can be used to filter diagrams that are assigned to a specific tag.

Diagram in diagram
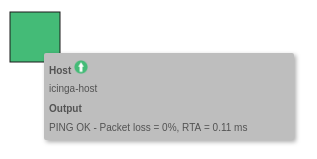
Diagrams can be linked to objects on other diagrams. A tooltip shows the status and a preview of the linked diagram.

Screenshots
Download Vision Testversion
Vision 1.2 trial version, unlimited use. Trial version limited to 8 diagrams, 8 hosts per diagram and 8 services per diagram. After a short registration you can download the trial version from the website.
system requirements
The basic requirements for using Vision are PHP 8.1 or 8.2 with Icinga Web 2 - Version 2.12.14
Requirements for Diagram-Thumbnails/-Screenshots with status colours:
pkill, Chrome/Chromium, IcingaWeb2 and Icinga2 need to run on the same host
Vision
Changelog

## Miscellaneous
* #269 Add update information to the documentation
* #270 Background colour and size of Icingaweb2 fields are changed from Vision module

Bugs
- #267 Long diagram names can't be altered
- #268 - Vision won't work with only monitoring module active

Bugs
- #248 Object browser does not respect user restrictions when using monitoring-module
- #246 Extend character length of diagram and diagram-template names
- #266 Problems with icingaweb2 version v2.11.5 and 2.12.3
Bugs
- [#263] Error in overview if diagrams contains objects where user has no rights
- [#250] Link-Object does not work in Polygons and Diamond
- [#248] Object browser does not respect user restrictions
- [#245] Diagram can not be used as dashlet, height is wrong
- [#243] Last added image is not displayed correctly
- [#242] Display of the wrong version number of vision
Icingashot
Bugs
- [#5] Icingashot runs in timeout using icinga2 with https
- [#4] Using of Icingashot leads to server going out of memory
- [#3] Update requirements for icingashot in documentation
Bugs
- [#237] State is still not correctly inherited
- [#238] ACK and DT modifier of state are not inherited to other diagram
- [#239] view-only user can still edit tags
- [#240] status colors do not respect ack and dt modifiers

Key features
- Vision 2.0.0 has been prepared to accommodate the new default IcingaDB data structure, fully taking advantage of it.
- Role-based permissions can now be defined, with a specific 'vision/edit' permission that grants designated users the ability to create, update, and delete diagrams. Additionally, the 'restrictions' setting enables fine-grained access control for diagrams based on name prefixes (Please note that prefix restrictions are only compatible with the new IcingaDB data structure)
- Have you ever wished to eliminate the 'icingaweb2' URL segment while retaining access to Vision? Now, you can.
Vision Improvements
- [improvement] #231 Customize icon color of ACK + Downtime
- [improvement] #233 Adapt new icingadb datastructure which is default in Iciniga 2.11.4
- [improvement] #234 Update vision design to fit icinga themes
- [improvement] #232 integrate view permissions
- [bug] #226 Status inheritance over multiple diagrams didn`t work
- [bug] #227 Faulty status display of the diagrams
- [bug] #230 Scaling of diagrams could be better
- [bug] #228 Boxes of the diagrams are displayed incorrectly
Bugs
#217 "/icingaweb2/vision" hard coded in vision module - after changing Web config vision module does not work anymore

Bugfix:
- Status of the Overview is now being updated every 30 seconds.
- Diagrams, which other Diagrams link to, have been fixed. Both the image and the state are now being displayed correctly.
- Linked Diagrams can now be deleted smoothly.
- "Usort" PHP error has been fixed.
- The frontend has been adjusted so that both themes (light and dark) can be used correctly.
Feature:
- New icons for when a host or service is in downtime or acknowledged

Features:
- The design has been adapted to the new standard theme of IcingaWeb 2.10 (lightmode and darkmode).
Tip:
For the correct display of thumbnails, it is recommended to use the light-theme. Due to the change in design, display errors may occur in older versions of Icinga Web2 (< als 2.10).
- MAC optimization
- PHP 8 support
- New Template (Map of Austria)
- Connection-Mode Node-Placement is now possible via the shift key (previously Strg+Alt)
- The notification-bar no longer vanishes behind the sidebar.
- Icingashot-Plugin output has been adjusted
- General styling of input fields and dropdown fields has been adjusted
- The standard Tag color is now Icinga blue and no longer grey
- The standard vision.conf module path is now the standard module path of Icinga
Please do not hesitate to contact us: +49 441 390 10 10 40