Report Manager
What is the Report Manager?
The report manager enables the simple creation of reports. It provides an interface to add individual elements (such as host or service availability) from different sources (SNAG-View, i-doit or OTRS). The reports include a table of contents, headings and footnotes that dynamically insert and adjust.
The output of the compiled reports can easily be done on own templates in corporate design, in different output formats, directly on paper or as PDF files, etc. For the execution of the reports, the Jasper Server is used in the background as a so-called reporting engine. The reports can thus be sent automatically by e-mail, for example on the first day of each month.

Simple reporting
Reports from various sources
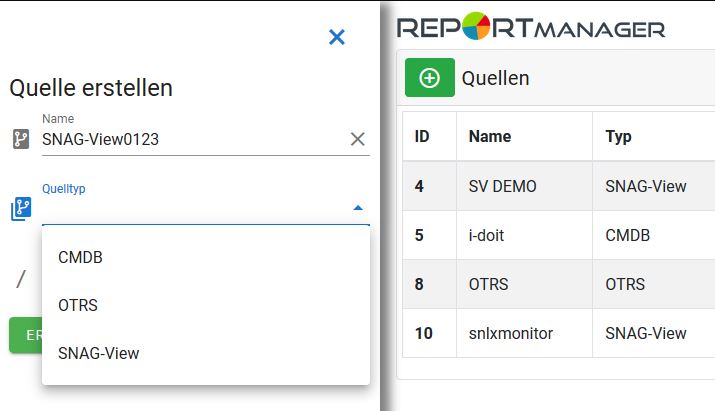
The Report Manager serves as a central tool for creating reports from different sources.
Each source is given a name under which it will later appear in the report compilations. Depending on the available licenses, the following modules are available as source types.
- SNAG-View
- OTRS
- i-doit
Sources
Basics
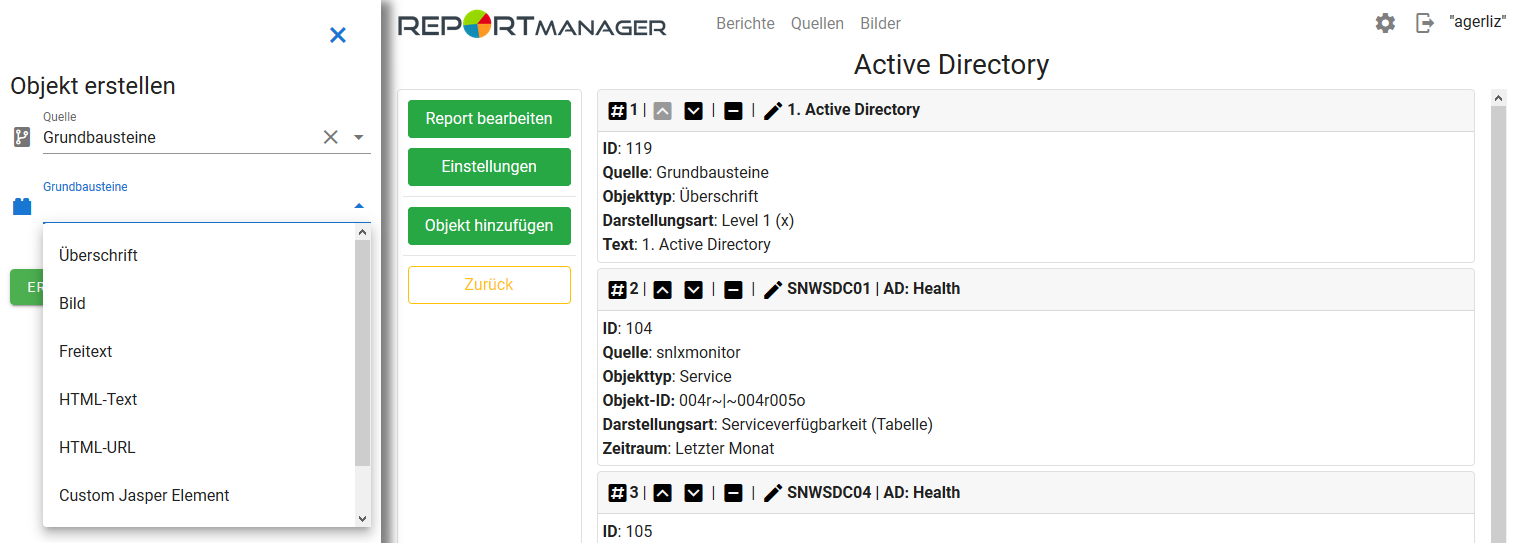
The basic building blocks include organizing and design elements that allow reporting to be authentic, including.
- Headings
- Images
- Free texts
- HTML texts
- HTML URL
- Custom Jasper elements
- Page breaks
SNAG-View
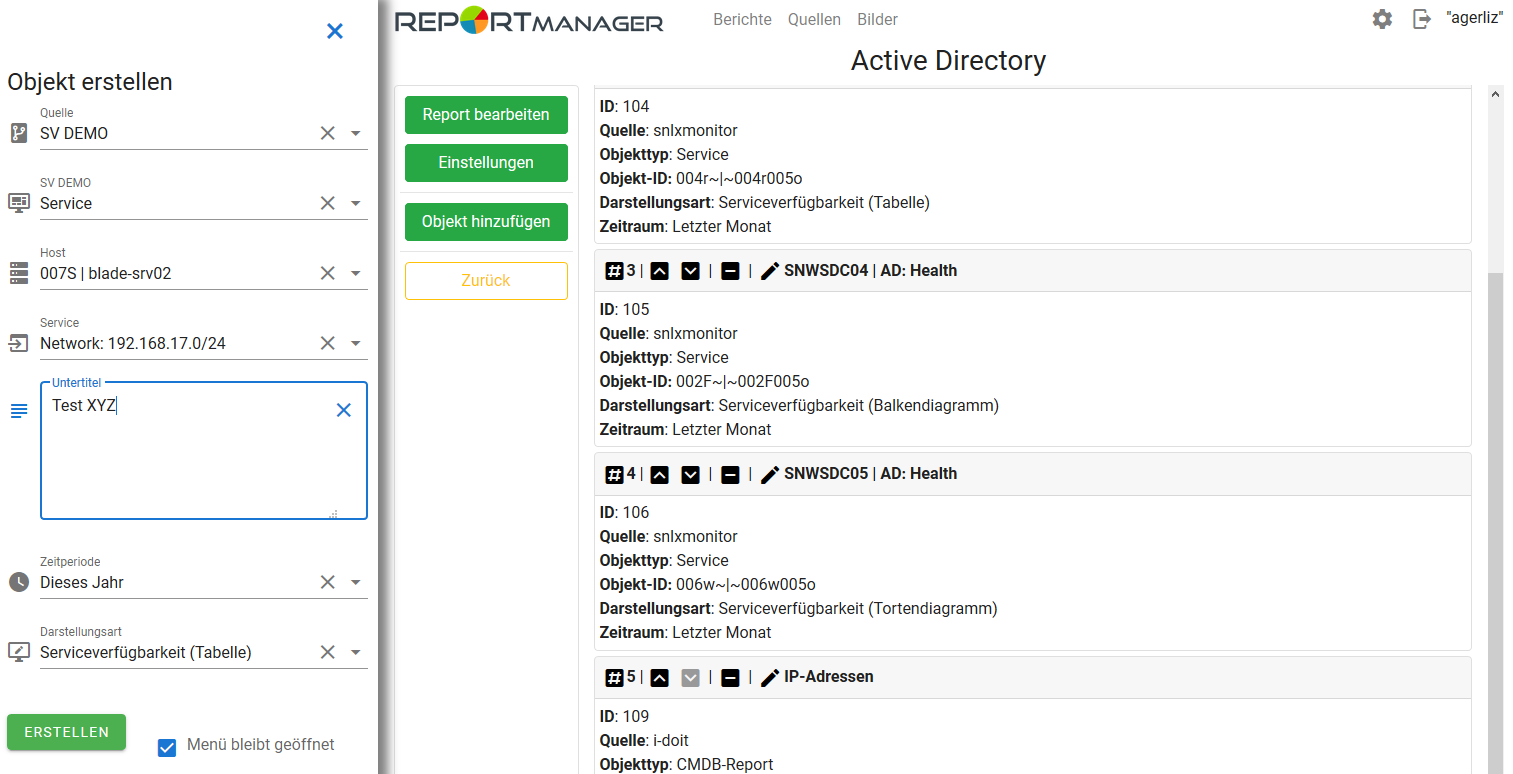
If a SNAG View Server is selected as the source, the following objects are available:
- Host group
- Service group
- Host
- Service
- Performance graph
The objects are read from SNAG-View and can be selected. Depending on the selected object type, the following options are available in the display type:
- Host availability (table, pie chart, bar chart)
- Service availability (table, pie chart, bar chart)
- Host and service availability (table)
- Outages (table)
- Host and service availability with failures (table)
- Performance graph
For all objects a time period has to be defined, which can be chosen differently up to one year.
((OTRS)) Community Edition
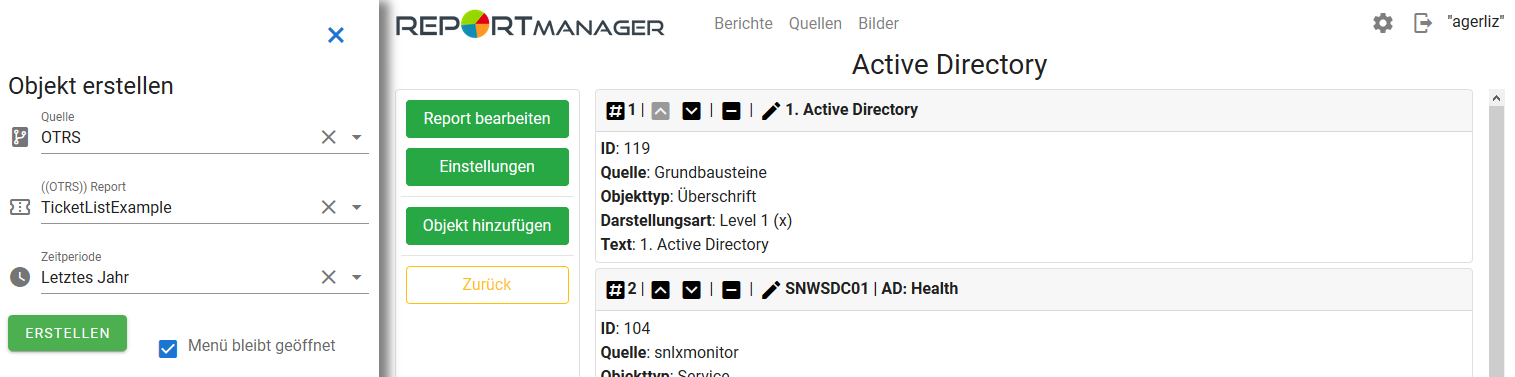
If OTRS is selected as the source, the installed reports are read from the OTRS server and can be added to the report. The time period to be considered must be added. The following reports are available:
- TicketSeriesExample
- TicketListExample
- ArticleListExample
- TicketClosedTime
- TicketCreatedTime
- OpenClosedPerQueue
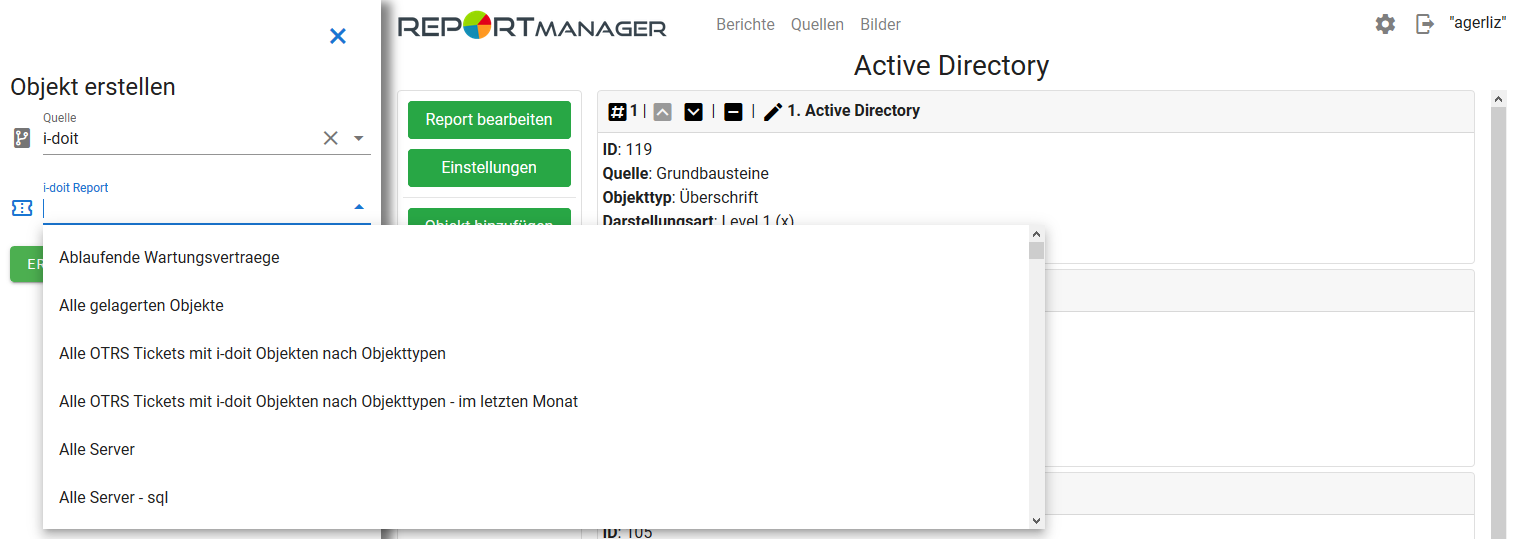
i-doit
When i-doit is selected as the source, the available reports are read from the i-doit server. All reports available in i-doit can be displayed with the ReportManager. A possibly desired time restriction of the report result can be stored in the SQL editor in the i-doit ReportManager.
In addition to the elements provided, user-defined subreports can also be used. These can be created with the Jaspersoft Studio.
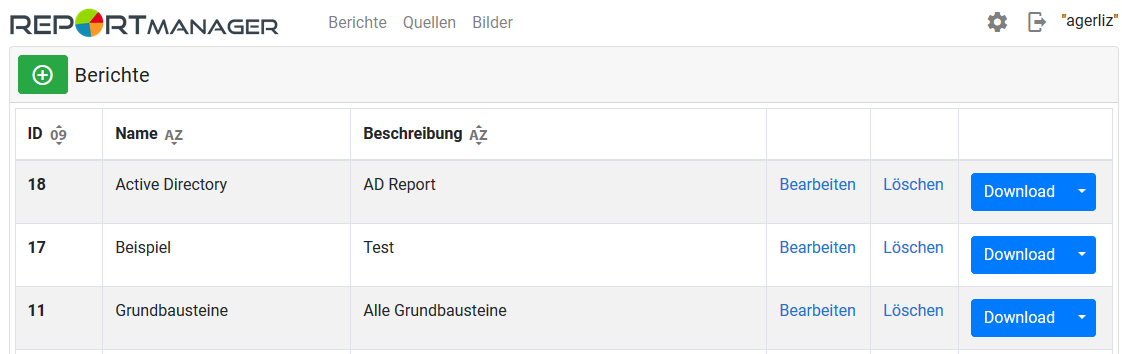
Manage reports clearly
The Report Manager allows you to create, edit and delete reports. In addition, the corresponding report can be downloaded via "Download" without having to open the Jasper server.
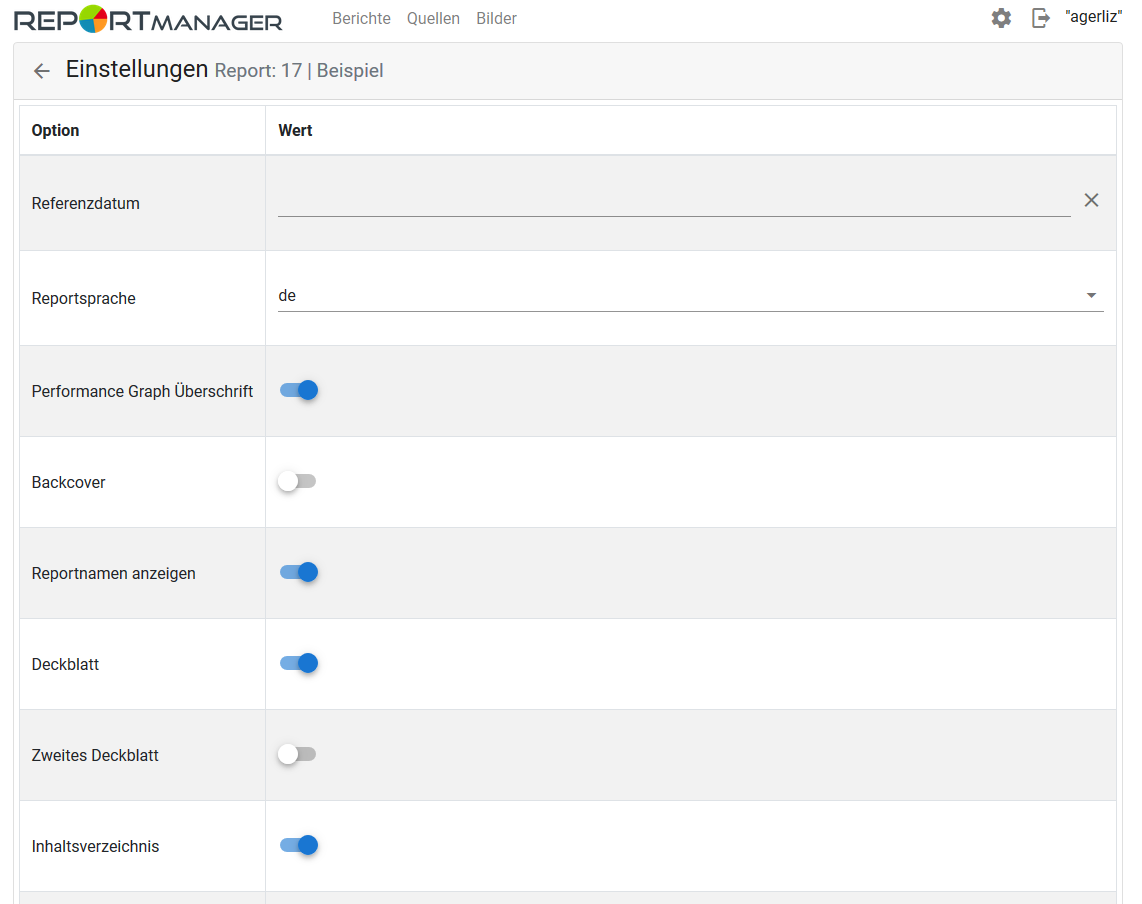
Customize layouts
After a report has been created, the "Edit Report" button can be used to configure the following properties concerning the layout, among others:
- Reference date
- Report language
- Backcover
- Cover page
- Table of contents
- Downtimes
- Thresholds
- Header & Footer Images