Interface
SNAG-View 4 and i-doit
The interface between the i-doit CMDB and the SNAG-View 4 monitoring suite serves as an intelligent data provider and enables i-doit objects to be quickly added to the monitoring system.
By selecting the device templates in i-doit, the system parameters to be checked or monitored by the monitoring system can be predefined when the monitoring is activated.
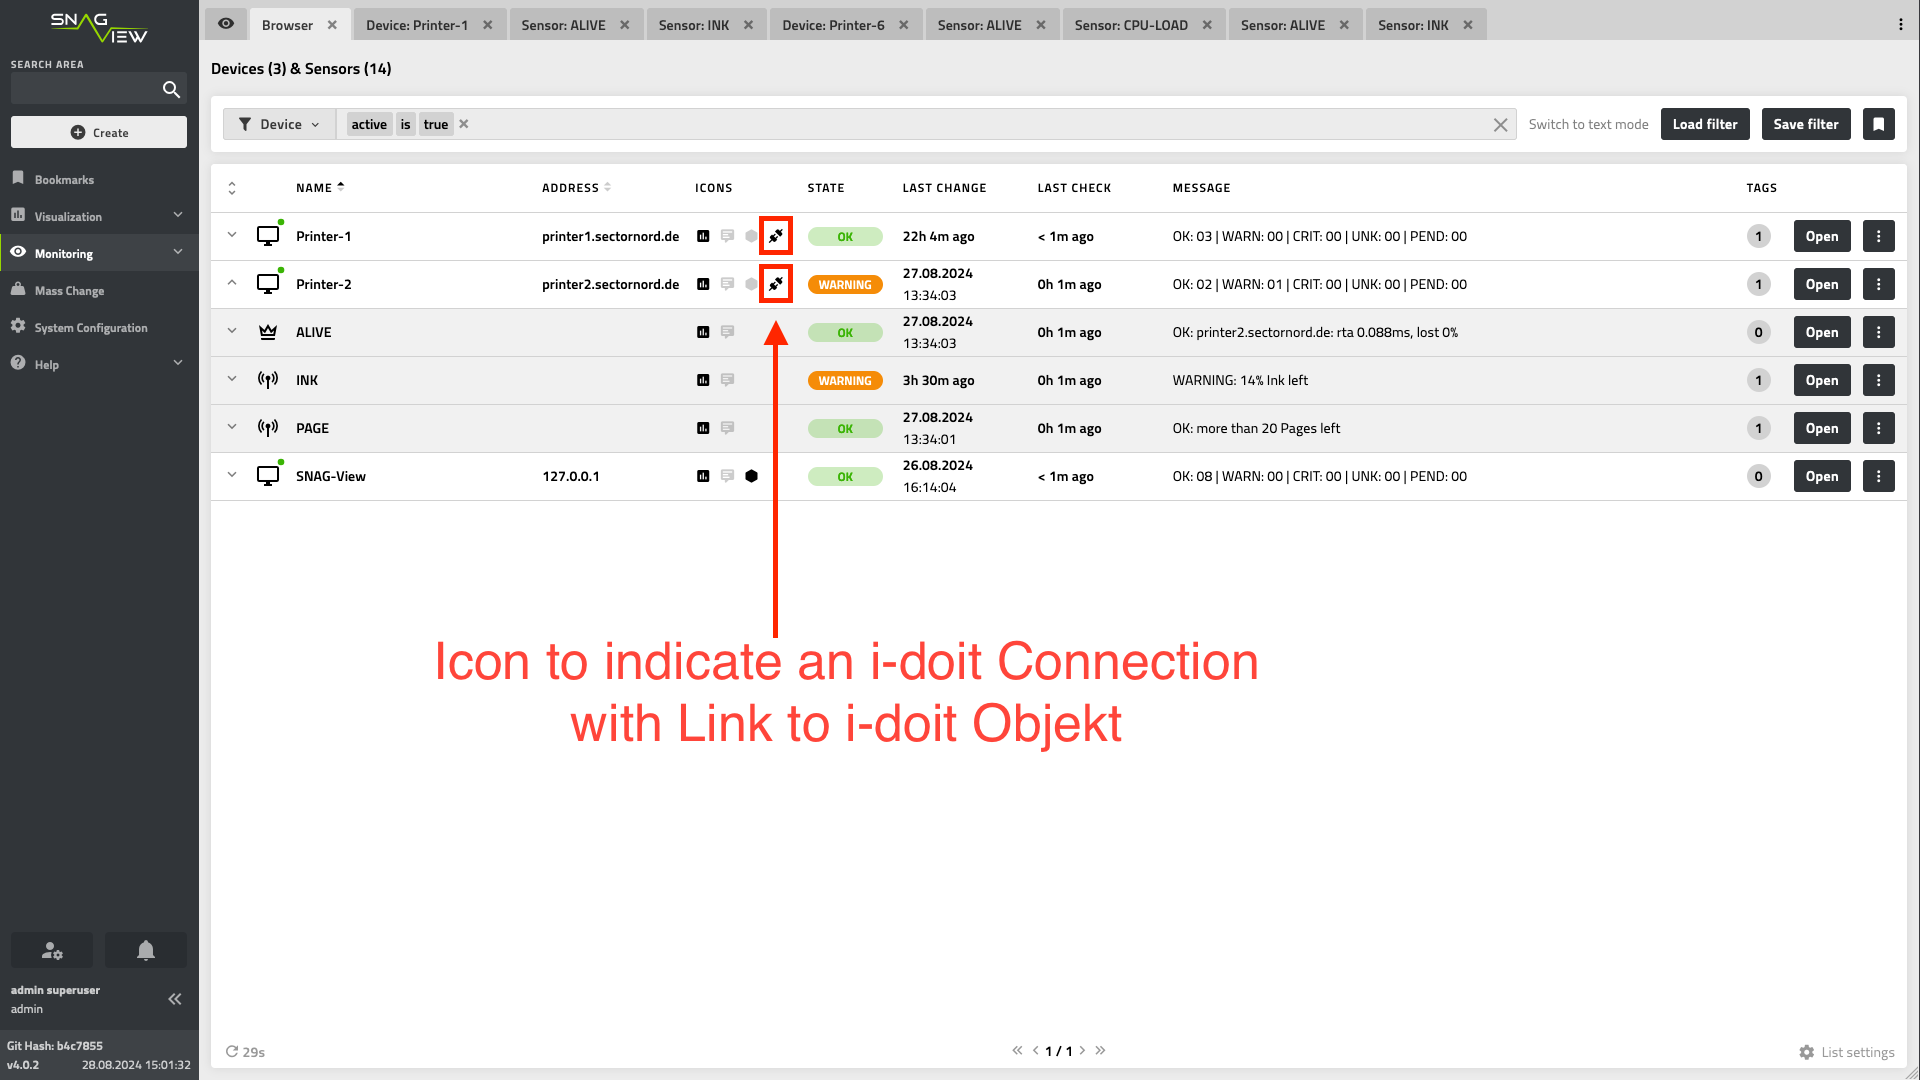
Within SNAG-View, a small icon indicates that the corresponding device originates from the i-doit CMDB and is managed there. This icon is linked to the overview page of the corresponding object in i-doit so that it can be accessed quickly if detailed information is required.
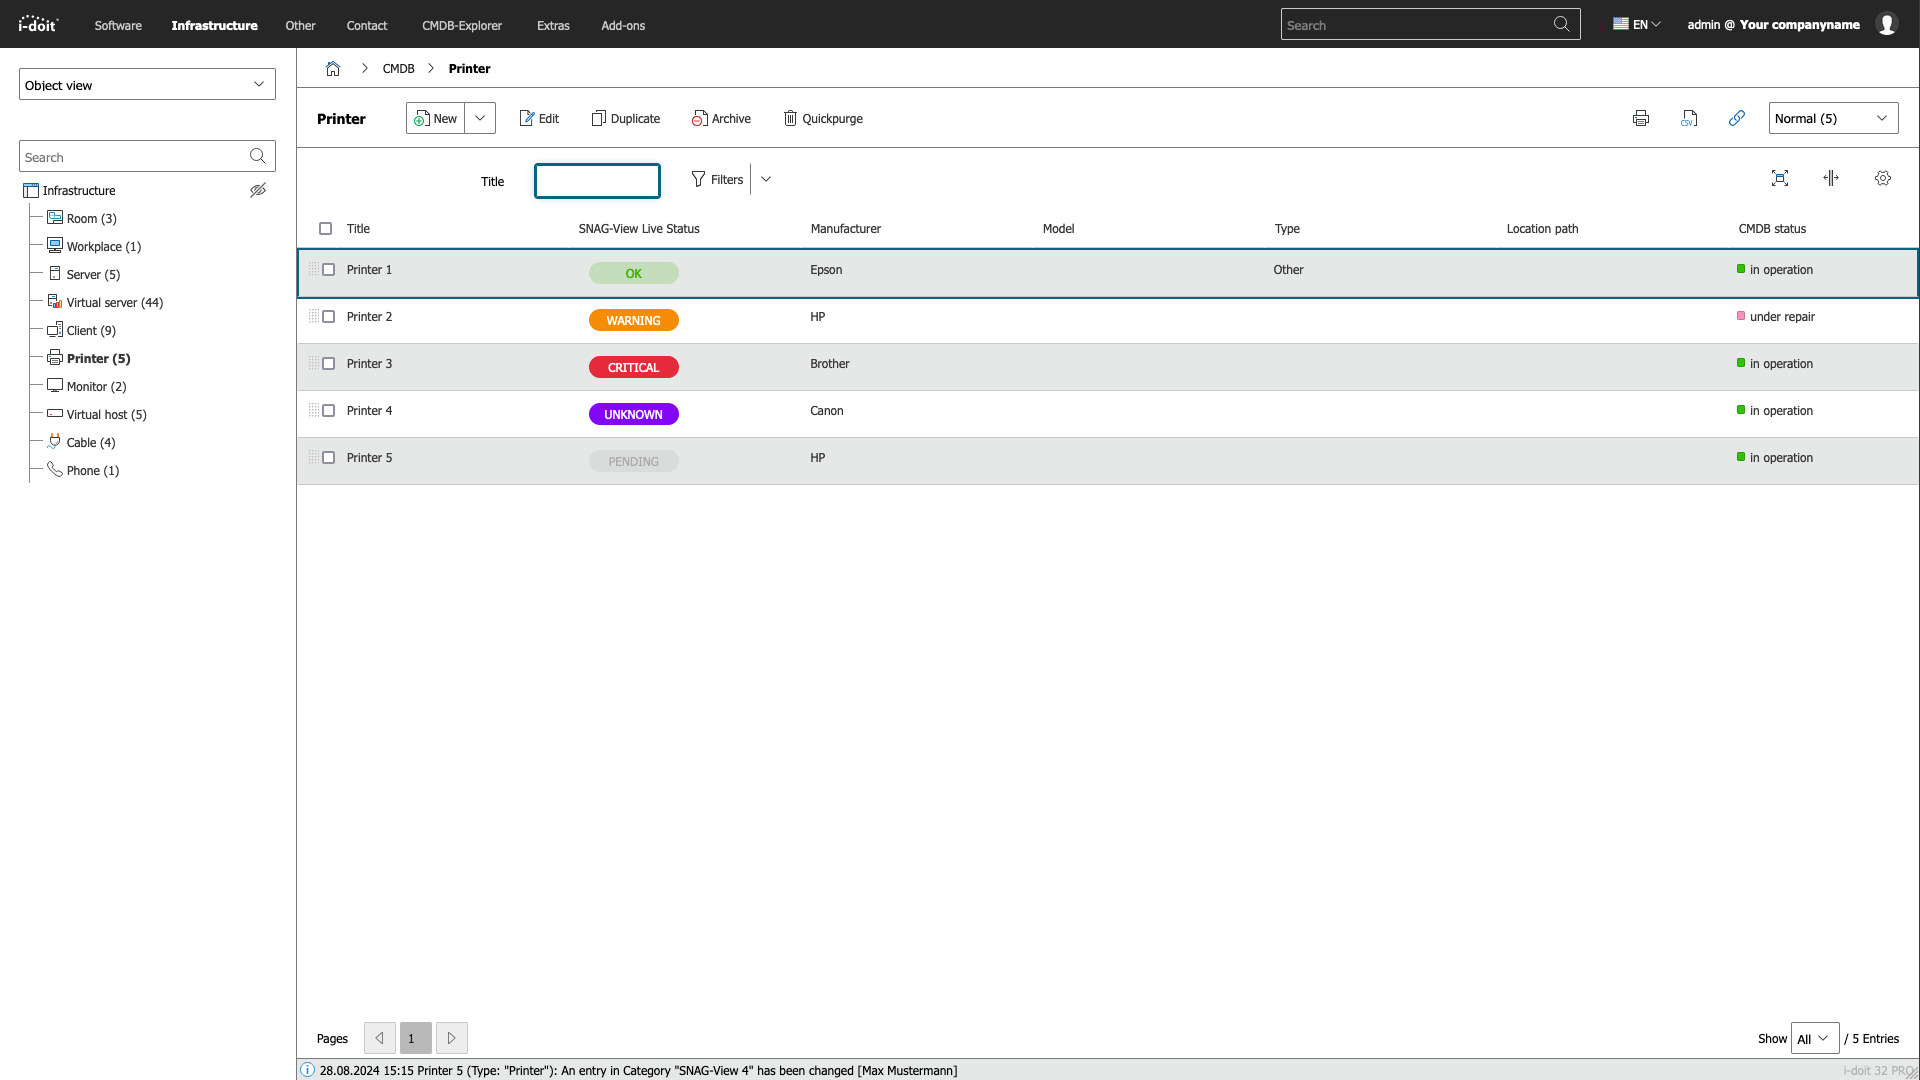
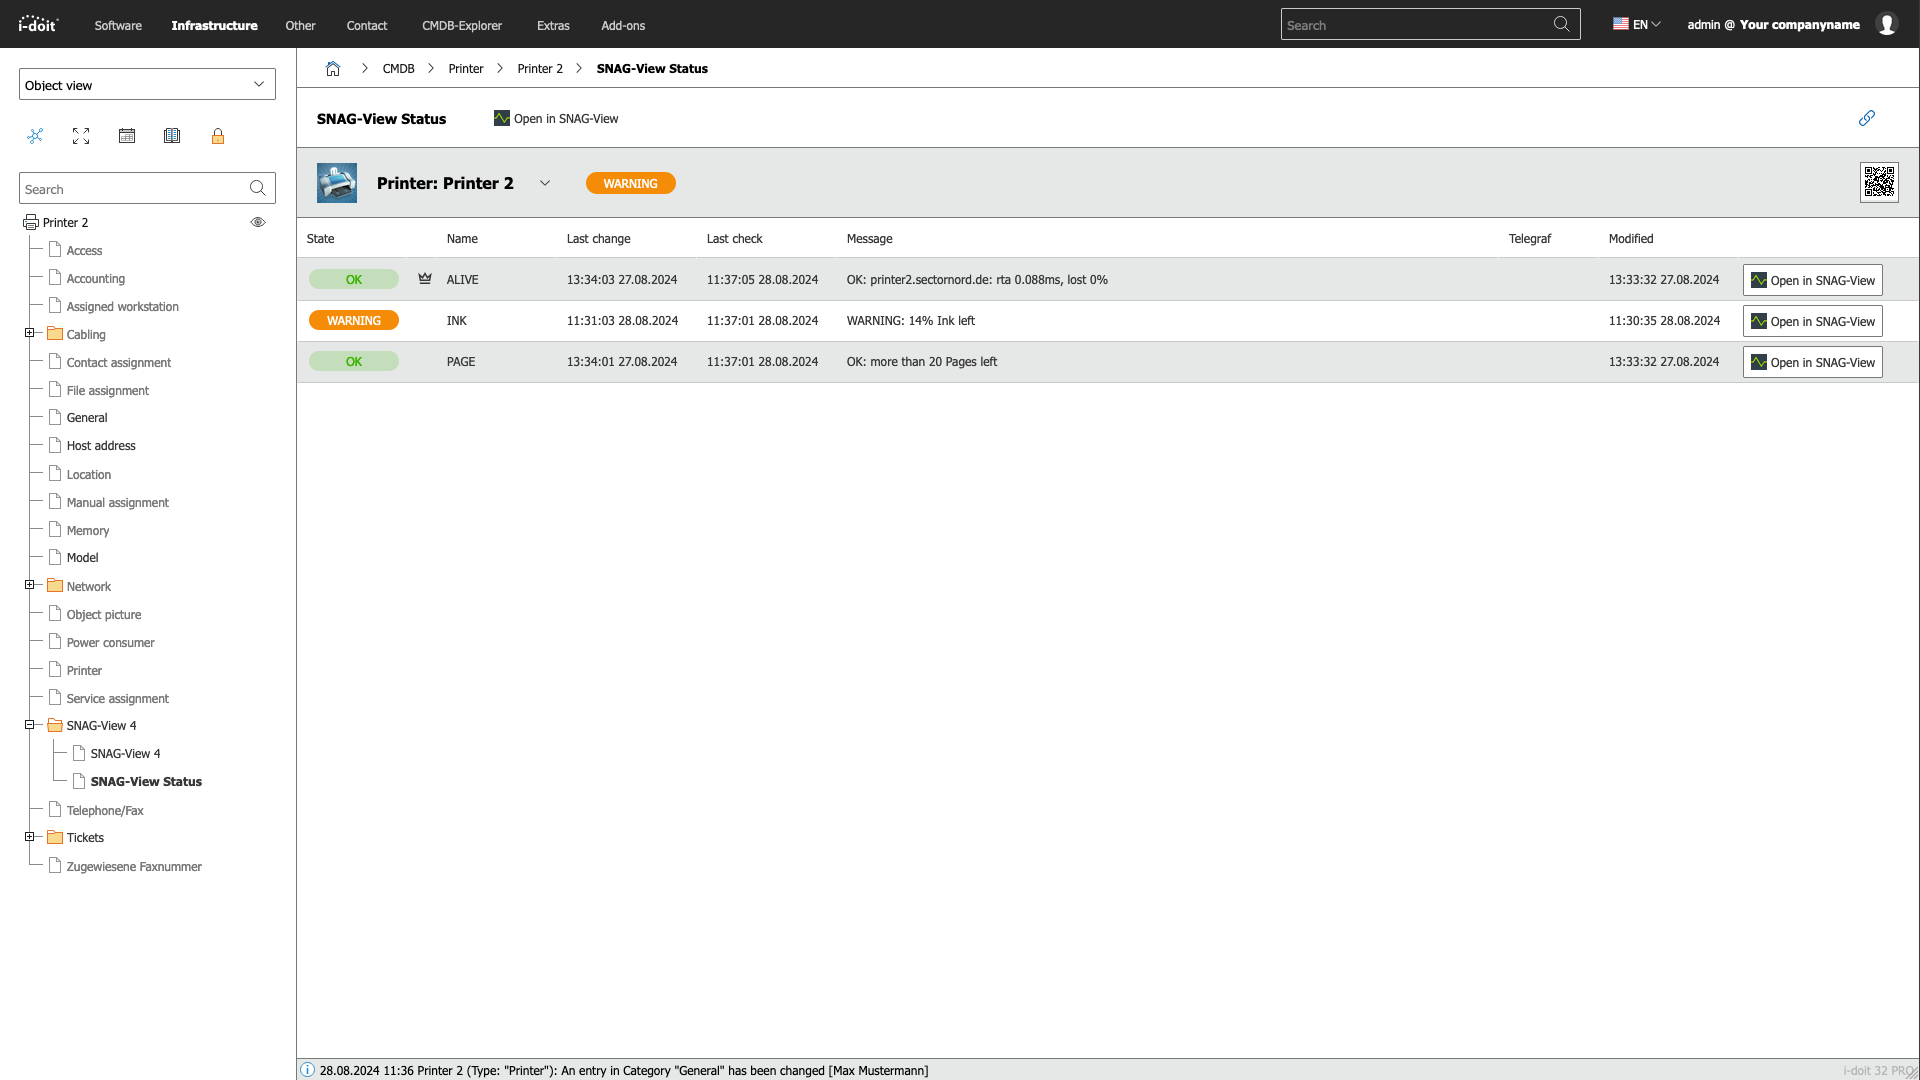
Within i-doit, the monitoring status is displayed live on the overview page of the object using a coloured icon.
Videos
Screenshots
SNAGView4-idoit-Connector
Changelog
- Added page to upload license to SNAG-View 4 Connector
- Added new icons
- Improved slot handling to integrate automatic import of devices from OCS
- Removed deprecated JS event DOMNodeInserted
- Improved handling to prevent double connected i-doit objects to a SNAG-View device
- Code improvements and refactoring
- Added compatibility for SNAG-View 4 0.19.0 (API Changes)
- Added console cmd to import teams and user teams assignments from i-doit to SV4
- Removed telegraf rollout (moved to SNAG-View 4 Core)
- Improved default selected address in category
- Improved documentation
- Fixed API error when updating a device to the same address